- Cisco Community
- Technology and Support
- Security
- Network Access Control
- Re: Cisco ISE authentication per Second
- Subscribe to RSS Feed
- Mark Topic as New
- Mark Topic as Read
- Float this Topic for Current User
- Bookmark
- Subscribe
- Mute
- Printer Friendly Page
- Mark as New
- Bookmark
- Subscribe
- Mute
- Subscribe to RSS Feed
- Permalink
- Report Inappropriate Content
05-30-2018 11:41 PM - edited 02-21-2020 10:57 AM
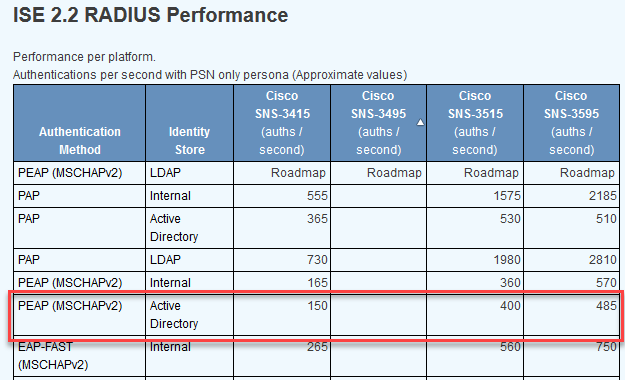
In document show 485 auths/second fro SNS-3595. How I can monitor this on Cisco ISE GUI or CLI
Solved! Go to Solution.
- Labels:
-
Other NAC
Accepted Solutions
- Mark as New
- Bookmark
- Subscribe
- Mute
- Subscribe to RSS Feed
- Permalink
- Report Inappropriate Content
05-31-2018 10:45 PM
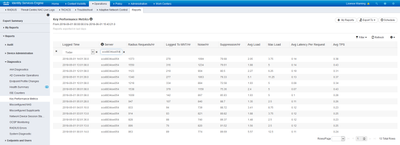
Yes - as Marvin pointed out, that is one method. The ISE GUI also has a KPI report if you find that more accessible?
- Mark as New
- Bookmark
- Subscribe
- Mute
- Subscribe to RSS Feed
- Permalink
- Report Inappropriate Content
05-31-2018 04:55 AM - edited 06-03-2018 06:38 AM
I don't believe you can get that exact statistic but you can pull average transactions per second using "application configure ise" from the cli and choosing option 12. You can then copy the files off box using scp or ftp to examine them.
ise-new/admin# application configure ise

Selection configuration option
[1]Reset M&T Session Database
[2]Rebuild M&T Unusable Indexes
[3]Purge M&T Operational Data
[4]Reset M&T Database
[5]Refresh Database Statistics
[6]Display Profiler Statistics
[7]Export Internal CA Store
[8]Import Internal CA Store
[9]Create Missing Config Indexes
[10]Create Missing M&T Indexes
[11]Enable/Disable ACS Migration
[12]Generate Daily KPM Stats
[13]Generate KPM Stats for last 8 Weeks
[14]Enable/Disable Counter Attribute Collection
[15]View Admin Users
[16]Get all Endpoints
[17]Enable/Disable Wifi Setup
[18]Reset Config Wifi Setup
[19]Establish Trust with controller
[20]Reset Context Visibility
[21]Synchronize Context Visibility With Database
[22]Generate Heap Dump
[23]Generate Thread Dump
[24]Force Backup Cancellation
[0]Exit

12
You are about to generate Daily KPM (Key Performance Metrics).
  % Warning  Generating KPM stats may impact ISE performance during the generation of the report.It is suggested to run this report during non-peak hours and when not conflicting with other scheduled operations of ISE.
Are you sure you want to proceed? y/n [n]: y
Starting to generate Daily KPM stats
Copying files to /localdisk
Completed generating daily KPM stats. You can find details in following files located under /localdisk
KPM_onboarding_results_31_MAY_2018.xls
KPM_trx_load_31_MAY_2018.xls
Some further discussion can be found here:
- Mark as New
- Bookmark
- Subscribe
- Mute
- Subscribe to RSS Feed
- Permalink
- Report Inappropriate Content
05-31-2018 10:45 PM
Yes - as Marvin pointed out, that is one method. The ISE GUI also has a KPI report if you find that more accessible?
- Mark as New
- Bookmark
- Subscribe
- Mute
- Subscribe to RSS Feed
- Permalink
- Report Inappropriate Content
05-31-2018 10:47 PM
- Mark as New
- Bookmark
- Subscribe
- Mute
- Subscribe to RSS Feed
- Permalink
- Report Inappropriate Content
06-08-2018 12:04 AM
- Mark as New
- Bookmark
- Subscribe
- Mute
- Subscribe to RSS Feed
- Permalink
- Report Inappropriate Content
06-17-2021 09:17 AM
Marvin, Arne,
could u pls explain LOGGED TO MNT/HR column meaning (value for arbitrary interval 2845)?
I guess i understand RADIUS REQUESTS as number of AAA requests during interval (seems to be 1 hour), right? it's value 17915, but what is then LOGGED TO MNT/HR which value times less?
br andy
- Mark as New
- Bookmark
- Subscribe
- Mute
- Subscribe to RSS Feed
- Permalink
- Report Inappropriate Content
06-17-2021 10:00 AM - edited 06-17-2021 10:02 AM
Hi @Andrii Oliinyk ,
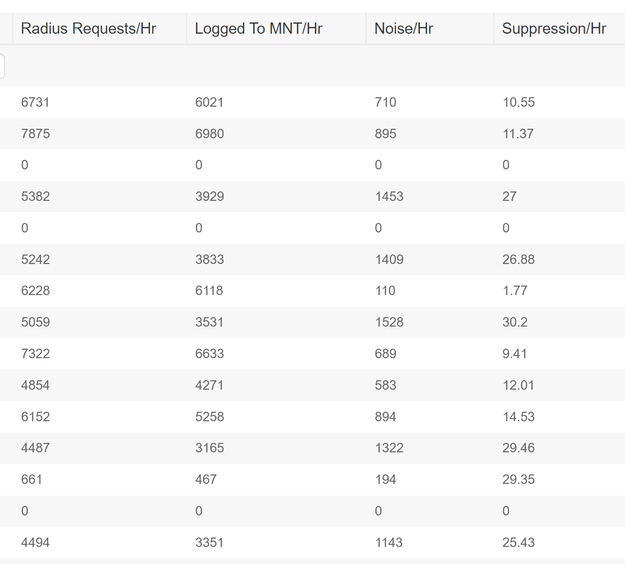
Logged Time: time data is collected (data collected every 5 mins is aggregated hourly)
Server: Server Name in the deployment
RADIUS Requests Per Hr: number of RADIUS Requests per Hour for selected PSN
Logged To MnT Per Hr: number of such requests logged to MnT database for selected PSN
Noise Per Hr: calculated as difference between RADIUS Request per Hour and Logged to MnT per Hour
Suppression Per Hr: calculated as percentage of Noise w.r.t. (with respect to) RADIUS Request per Hour for selected PSN
Avg Load: average server load for selected server
Max Load: maximum server load for selected server
Avg Latency Per Request: average latency per RADIUS Requests for selected PSN
Avg TPS: average transactions per second calculated as number of RADIUS Requests served per second by PSN
Hope this helps !!
- Mark as New
- Bookmark
- Subscribe
- Mute
- Subscribe to RSS Feed
- Permalink
- Report Inappropriate Content
06-17-2021 11:28 AM - edited 06-17-2021 11:31 AM
tnx Marcelo
why RADIUS Requests Per Hr: number of RADIUS Requests per Hour for selected PSN
Logged To MnT Per Hr: number of such requests logged to MnT database for selected PSN
r differ so much?
- Mark as New
- Bookmark
- Subscribe
- Mute
- Subscribe to RSS Feed
- Permalink
- Report Inappropriate Content
06-17-2021 12:38 PM
Hi @Andrii Oliinyk ,
the Noise per Hr and Suppression per Hr indicate that, the cause ... take a look at: Administration > System > Settings > Protocols > RADIUS > Suppression and Reports tab.
Hope this helps !!!
- Mark as New
- Bookmark
- Subscribe
- Mute
- Subscribe to RSS Feed
- Permalink
- Report Inappropriate Content
06-17-2021 11:24 PM
tnx Marcelo.
is it though expected to have Noise per Hr and Suppression per Hr empty in the report?
br andy
- Mark as New
- Bookmark
- Subscribe
- Mute
- Subscribe to RSS Feed
- Permalink
- Report Inappropriate Content
06-18-2021 07:34 AM
if the RADIUS Requests Per Hr and Logged To MnT Per Hr are the same, then the Noise per Hr and Suppression per Hr are equal to 0.
For example, each line is a different Node:
PAN: 3rd line
0
MnT: 5th line
0
PSN: 1st line (example)
RADIUS Request/Hr: 6731
Logged to MnT/Hr: 6021
Noise/Hr: 710 (6731 - 6021)
Suppression/Hr: 10.55 (710/6731)
Note: I didn't remember to see an empty value !!!
Hope this helps !!!
- Mark as New
- Bookmark
- Subscribe
- Mute
- Subscribe to RSS Feed
- Permalink
- Report Inappropriate Content
06-17-2021 07:53 AM
Hi Arne
in old SW (like 2.1) there is no GUI option, but CLI's one presents.
Discover and save your favorite ideas. Come back to expert answers, step-by-step guides, recent topics, and more.
New here? Get started with these tips. How to use Community New member guide


