- Cisco Community
- Technology and Support
- Security
- Network Access Control
- Re: ISE 1.2 does not do HTTP profiling ???
- Subscribe to RSS Feed
- Mark Topic as New
- Mark Topic as Read
- Float this Topic for Current User
- Bookmark
- Subscribe
- Mute
- Printer Friendly Page
ISE 1.2 does not do HTTP profiling ???
- Mark as New
- Bookmark
- Subscribe
- Mute
- Subscribe to RSS Feed
- Permalink
- Report Inappropriate Content
08-15-2013 09:42 AM - edited 03-10-2019 08:46 PM
Hi, guys.
Has anyone ISE 1.2 Patch 1 successfully enabled to do profiling using HTTP on a monitor session/span port ???
I have tried the following:
- DMZ switch, which holds a vlan where (only) the central proxy server resides
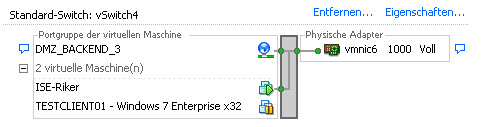
- ESX 5.1 host, one nic connected to the DMZ switch
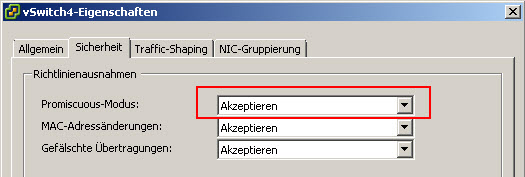
- configured a virtual switch/network on this host, which uses the nic connected to the DMZ switch (enabled promiscious mode on the vswitch and network)
- ISE 1.2 Patch 1 installed on the ESX host, two interfaces (Gig 0 and 1), Gig 1 connected to the vswitch and virtual network
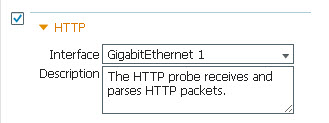
- configured virtual ISE to do http profiling on Gig 1
Here are some shows:
#sh moni
Session 1
---------
Type : Local Session
Source VLANs :
Both : xx
Destination Ports : Gi2/0/48
Encapsulation : Native
Ingress : Disabled
#sh run int gig2/0/48
interface GigabitEthernet2/0/48
description *** ISE Proxy SPAN Port
switchport access vlan xx
The span destination port shows lots of outgoing packets:
#sh int gig2/0/48
GigabitEthernet2/0/48 is up, line protocol is down (monitoring)
Hardware is Gigabit Ethernet, address is 588d.0941.7130 (bia 588d.0941.7130)
Description: *** ISE-Riker Proxy SPAN Port
MTU 1500 bytes, BW 1000000 Kbit, DLY 10 usec,
reliability 255/255, txload 10/255, rxload 1/255
Encapsulation ARPA, loopback not set
Keepalive set (10 sec)
Full-duplex, 1000Mb/s, media type is 10/100/1000BaseTX
input flow-control is off, output flow-control is unsupported
ARP type: ARPA, ARP Timeout 04:00:00
Last input never, output 00:22:36, output hang never
Last clearing of "show interface" counters 03:03:20
Input queue: 0/75/0/0 (size/max/drops/flushes); Total output drops: 14352300
Queueing strategy: fifo
Output queue: 0/40 (size/max)
5 minute input rate 0 bits/sec, 0 packets/sec
5 minute output rate 42962000 bits/sec, 13051 packets/sec
33 packets input, 2436 bytes, 0 no buffer
Received 33 broadcasts (18 multicasts)
0 runts, 0 giants, 0 throttles
0 input errors, 0 CRC, 0 frame, 0 overrun, 0 ignored
0 watchdog, 18 multicast, 0 pause input
0 input packets with dribble condition detected
223104868 packets output, 98731284385 bytes, 0 underruns
0 output errors, 0 collisions, 0 interface resets
0 babbles, 0 late collision, 0 deferred
0 lost carrier, 0 no carrier, 0 PAUSE output
0 output buffer failures, 0 output buffers swapped out
But the interface on ISE hardly shows any incoming packets:
# sh int gig 1
GigabitEthernet 1
Link encap:Ethernet HWaddr 00:50:56:8D:4A:C1
inet6 addr: fe80::250:56ff:fe8d:4ac1/64 Scope:Link
UP BROADCAST RUNNING MULTICAST MTU:1500 Metric:1
RX packets:3810 errors:0 dropped:0 overruns:0 frame:0
TX packets:12 errors:0 dropped:0 overruns:0 carrier:0
collisions:0 txqueuelen:1000
RX bytes:347928 (339.7 KiB) TX bytes:936 (936.0 b)
Interrupt:67 Base address:0x20a4
I have tested if the vmware virtual network makes the packets disappear, therefore I have connected a windows virtual machine to the same network as ISE
Running Wireshark on this windows machine shows me LOOOOOTS of http packets on this virtual network, seem like the ISE nic just doesn't see them ......
Any ideas ???
Rgs
Frank
- Labels:
-
AAA
- Mark as New
- Bookmark
- Subscribe
- Mute
- Subscribe to RSS Feed
- Permalink
- Report Inappropriate Content
08-15-2013 11:20 AM
Frank,
Have you tried to run a packet capture on the gig 1 interface through the support tools? See if you can get a copy of the http headers.
Tarik Admani
*Please rate helpful posts*
- Mark as New
- Bookmark
- Subscribe
- Mute
- Subscribe to RSS Feed
- Permalink
- Report Inappropriate Content
08-16-2013 12:57 AM
Hi, Tarik.
Nice hint, I totally forgot the support tools ..... 🙂
Used the tcp dump support tool to capture Gig 1 on ise:

Viewing the dump file with wireshark shows lots of http packets:

So, the monitoring session works ok, vmware virtual network does not swallow the packets,
they arrive on Gig 1 of ise, but looks like they are simply not processed .....
Rgs
Frank
- Mark as New
- Bookmark
- Subscribe
- Mute
- Subscribe to RSS Feed
- Permalink
- Report Inappropriate Content
08-16-2013 07:23 AM
Update:
I have connected another ISE 1.2 P1 (different one) with gig 1 to the virtual span network on the host and enabled http profiling on that ise, too. This time I used the cli "tech dumptcp" on that second ise to check, if span packets arrive on the ise nic.
Lots of http packets, too ......
# tech dumptcp 1
Invoking tcpdump. Press Control-C to interrupt.
tcpdump: WARNING: eth1: no IPv4 address assigned
tcpdump: listening on eth1, link-type EN10MB (Ethernet), capture size 96 bytes
14:16:10.545083 IP (tos 0x0, ttl 120, id 16220, offset 0, flags [DF], proto: TCP (6), length: 40) 10.x.y.142.52788 > 10.x.y.211.8080: ., cksum 0x3055 (correct), 1867362316:1867362316(0) ack 3989370400 win 64170
14:16:10.545271 IP (tos 0x0, ttl 128, id 16724, offset 0, flags [DF], proto: TCP (6), length: 1420) 10.x.y.211.8080 > 10.x.y.142.52788: . 78661:80041(1380) ack 0 win 258
14:16:10.545281 IP (tos 0x0, ttl 128, id 16725, offset 0, flags [DF], proto: TCP (6), length: 1420) 10.x.y.211.8080 > 10.x.y.142.52788: . 80041:81421(1380) ack 0 win 258
......
14:16:10.546312 IP (tos 0x0, ttl 128, id 16764, offset 0, flags [DF], proto: TCP (6), length: 1420) 10.x.y.211.8080 > 10.x.y.30.51413: . 51061:52441(1380) ack 0 win 255
So the problem is not bound to a specific ise, all 1.2 ise do not profile http ....
The final message you get on the cli is quite interesting though:
610 packets captured
29216 packets received by filter
28469 packets dropped by kernel
What filter ??? And why are that much packets dropped ???
Rgs
Frank
- Mark as New
- Bookmark
- Subscribe
- Mute
- Subscribe to RSS Feed
- Permalink
- Report Inappropriate Content
08-21-2013 05:11 AM
Second Update:
- Installed another (standalone) ISE with latest 1.1.4 version and patches
- connected ISE to vmware SPAN network with gig 1
- configured ISE to do http profiling on gig 1 only (nothing else)
- "sh int gig 1" show rapidly increasing packet counters
- Identites/Endpoints gui show lots of devices profiled into the correct classes (Win7, WinXP, ...), all devices were identified by the http user agent attribute
--->> HTTP profiling works !!!!
- Upgraded ISE 1.1.4 P3 to 1.2 via cli (used file: ise-upgradebundle-1.1.x-to-1.2.0.899.i386.tar.gz)
- "sh int gig 1" shows hardly any packet counts at all (monitoring session still running)
- Identites/Endpoints gui shows no additional devices
-->> HTTP profiling NOT working anymore !!!!
Results:
- HTTP profiling does not work:
- in newly installed ISE 1.2 (installed from .iso)
- in upgraded ISE 1.2 (via 1.2 upgrade-bundle)
- HTTP profiling does work:
- on ISE 1.1.4
Since the underlying operation system has been changed heavily from 1.1 to 1.2, I would think that maybe
the nic driver of the os could be most likely the issue here (promiscuous mode missing ???) .....
Rgs
Frank
- Mark as New
- Bookmark
- Subscribe
- Mute
- Subscribe to RSS Feed
- Permalink
- Report Inappropriate Content
08-21-2013 09:59 AM
1. it is vm, right? can you get netstat -i?
2. Did you configure an ip for the span receive interface? if not, you must configure one to make it work.
looks like you don't have one,,, pls configure one...
tcpdump: WARNING: eth1: no IPv4 address assigned
3. on vswitch make sure the port is in promiscuous mode.
Sent from Cisco Technical Support iPad App
- Mark as New
- Bookmark
- Subscribe
- Mute
- Subscribe to RSS Feed
- Permalink
- Report Inappropriate Content
08-22-2013 12:58 AM
1. it is vm, right?
Yepp !!
can you get netstat -i?
Executed where ?? On the esx host ?? On the ise vm ??
What do you expect to see ??
2. Did you configure an ip for the span receive interface?
No, why should this be necessary ?? (switchport, wireshark, etc. don't need an ip to capture
packets on a promiscuous interface, even ISE 1.1.4 didn't need one on the http profiling interface .....)
Configuration guide doesn't say so anyway ......
if not, you must configure one to make it work.
looks like you don't have one,,, pls configure one...
Ok, ok ..., configured an ip address, checked the profiling attributes ...
Result: did not make any difference ..... (tadaaaahhhhh !!!)
tcpdump: WARNING: eth1: no IPv4 address assigned
Right, but tcpdump shows dozens of live packets as they arrive live on ise, they are just not reflected in the "sh int gig 1" counters
and furthermore not picked up by the application, that is why I would suspect a nic driver malfunction on the underlying linux os ......
3. on vswitch make sure the port is in promiscuous mode.
As I already mentioned before in this thread, it is.
If the vmware virtual network inbetween ise and the non-virtual network would swallow the packets, why would "tech dumptcp 1" show anything at all ??
(see screenshots above)
Rgs
Frank
- Mark as New
- Bookmark
- Subscribe
- Mute
- Subscribe to RSS Feed
- Permalink
- Report Inappropriate Content
09-19-2013 11:46 PM
So, no update here, nothing to that matter to be found in the bug toolkit, no update/patch for ISE 1.2 either.
Nobody out there, who has encountered the same problem ???
Rgs
Frank
- Mark as New
- Bookmark
- Subscribe
- Mute
- Subscribe to RSS Feed
- Permalink
- Report Inappropriate Content
10-18-2013 04:49 PM
Kindly find the link below may help you have some information and address your query.
http://www.cisco.com/en/US/docs/security/ise/1.2/user_guide/ise_ug.pdf
HTTP SPAN Probe ( on page no. 405)
Unable to Collect HTTP Attributes in Cisco ISE Running on VMware ( on page no. 405)
- Mark as New
- Bookmark
- Subscribe
- Mute
- Subscribe to RSS Feed
- Permalink
- Report Inappropriate Content
10-19-2013 02:26 PM
This doesn't help at all, sorry.
What might be in that doc on page 405 that would help:
- Ensure that promiscous mode on the vmware switch is enabled ??
Yeah, like I said five times before in this thread, IT IS !!!
Do you read threads before you post an answer ??
"tech dumptcp 1" shows that packets are arriving, but are:
1. not picked up by the application
2. not reflected in "sh int gi 1"
- Turn on DHCP SPAN probe and HTTP probe on the same interface, then HTTP will work ??
Not really, done that already when I first saw that HTTP probe doesn't work (turned on all probes
on that interface to see, if any traffic is recognized by the application on that nic, surpise: it isn't !!!) ....
As you might notice, I am quite pi****ed with this situation.
I personally think, this is a MAJOR showstopper for any ISE installation in our enterprise, if not resolved quickly ....
Rgs
Frank
- Mark as New
- Bookmark
- Subscribe
- Mute
- Subscribe to RSS Feed
- Permalink
- Report Inappropriate Content
10-21-2013 09:38 AM
Hello Frank,
I believe you might check from Operation > Troubleshoot > Download Logs > [YOURISE] > Deubg Logs > Profiler Log.
I am not sure this is documented somewhere (didn't checked to be honest), but if you do not have an IP address on your interface, you would get such messages:
2013-10-21 18:25:44,118 ERROR [ProfilerController-1-thread-1][] cisco.profiler.infrastructure.probemgr.ProbeLoader -:::- Loading all probes failed.:Loading probe httpfailed. HTTP probe cannot be started on any of the configured network interfaces - eth1 either because those interfaces do not exist or are down.
com.cisco.profiler.common.ProfilerException: Loading probe httpfailed. HTTP probe cannot be started on any of the configured network interfaces - eth1 either because those interfaces do not exist or are down.
Caused by: com.cisco.profiler.common.ProfilerException: HTTP probe cannot be started on any of the configured network interfaces - eth1 either because those interfaces do not exist or are down.
Once you setup an IP address and restart the ISE Services, it should come up fine:
2013-10-21 18:33:41,144 INFO [ProfilerController-1-thread-1][] cisco.profiler.probes.http.HttpProbe -:::- Configuring HTTP probe.
2013-10-21 18:33:41,145 INFO [ProfilerController-1-thread-1][] cisco.profiler.probes.http.HttpProbe -:::- Starting HTTP probe.
2013-10-21 18:33:41,145 INFO [ProfilerController-1-thread-1][] cisco.profiler.probes.http.HttpProbe -:::- Starting HTTP SPAN probe on device:eth1
If that doesn't help, you might open a TAC Case.
Discover and save your favorite ideas. Come back to expert answers, step-by-step guides, recent topics, and more.
New here? Get started with these tips. How to use Community New member guide