- Cisco Community
- Technology and Support
- Security
- Network Access Control
- Re: ISE SNMP Trap - dskThresholdLimit - what is the OID?
- Subscribe to RSS Feed
- Mark Topic as New
- Mark Topic as Read
- Float this Topic for Current User
- Bookmark
- Subscribe
- Mute
- Printer Friendly Page
")
")
- Mark as New
- Bookmark
- Subscribe
- Mute
- Subscribe to RSS Feed
- Permalink
- Report Inappropriate Content
07-04-2017 07:00 PM
Hi
I have two MNT nodes with 1.2TB HDD's - it's a new deployment and currently I am unlikely to have any disk capacity issues. But I wanted to set up the one and only SNMP Trap that ISE offers. We use PRTG and there is a Probe that listens for SNMP Traps - the issue I have is that I am unable to see the OID that relates to this trap below - I need the exact OID for the PRTG filter to react correctly.
I could not find anything useful in the ISE documentation - ACS documentation mentions dskThresholdLimit (
.iso.org.dod.internet.private.enterprises.ucdavis.dskTable.dskEntry.dskPath ) - I did a Google search and found
1.3.6.1.4.1.2021.9.1.9 (http://oidref.com/1.3.6.1.4.1.2021.9.1.9)
Below is what I have configured on my MNT node
snmp-server trap dskThresholdLimit "1"
snmp-server host snmp-host-123 version 2c public
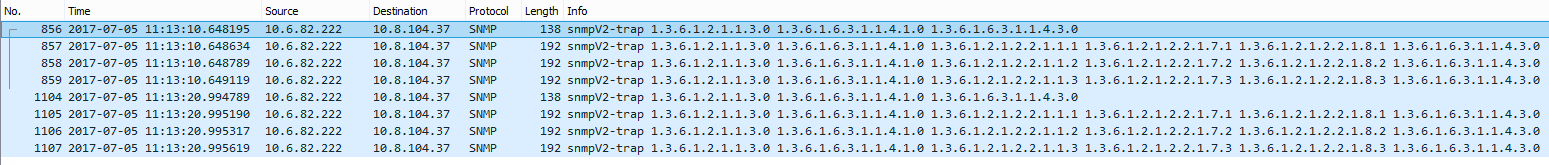
I applied the config above and analysed in Wireshark. ISE sent me a few Link Down/Up and uptime traps etc. Wasn't expecting those. And I didn't see anything to do with disk space.
It appears as if I am already over the 1% usage threshold, so I should get a trap?
What am I doing wrong ?
sco8834ise050/admin# show disks
disk repository: 2% used (203644 of 14987616)
Internal filesystems:
/ : 16% used ( 2135924 of 14987616)
/dev : 0% used ( 0 of 32895148)
/dev/shm : 0% used ( 0 of 32905156)
/run : 1% used ( 768 of 32905156)
/sys/fs/cgroup : 0% used ( 0 of 32905156)
/tmp : 1% used ( 6556 of 1983056)
/boot : 23% used ( 103749 of 487634)
/storedconfig : 2% used ( 1582 of 95054)
/opt : 3% used ( 31054032 of 1212603984)
/run/user/440 : 0% used ( 0 of 6581032)
/run/user/301 : 0% used ( 0 of 6581032)
/run/user/321 : 0% used ( 0 of 6581032)
/run/user/0 : 0% used ( 0 of 6581032)
/run/user/304 : 0% used ( 0 of 6581032)
/run/user/303 : 0% used ( 0 of 6581032)
all internal filesystems have sufficient free space
ISE 2.2p1
Solved! Go to Solution.
- Labels:
-
Identity Services Engine (ISE)
Accepted Solutions
- Mark as New
- Bookmark
- Subscribe
- Mute
- Subscribe to RSS Feed
- Permalink
- Report Inappropriate Content
07-06-2017 01:41 PM
I learned today that the trap is done through a scheduled job running every 5 minutes.
And, what you defined is the reverse.
snmp-server trap dskThresholdLimit shows,
snmp-server trap dskThresholdLimit value
Number that represents the percentage of available disk space. The value ranges from 1 to 100. |
So, you would use something like 99 as the value instead of 1.
- Mark as New
- Bookmark
- Subscribe
- Mute
- Subscribe to RSS Feed
- Permalink
- Report Inappropriate Content
07-04-2017 08:17 PM
It's a known issue that disk check not enabled in recent releases.
CSCve86955 is the bug ID. I just updated it so it will take ~ 24 hours before external visible.
- Mark as New
- Bookmark
- Subscribe
- Mute
- Subscribe to RSS Feed
- Permalink
- Report Inappropriate Content
07-06-2017 01:41 PM
I learned today that the trap is done through a scheduled job running every 5 minutes.
And, what you defined is the reverse.
snmp-server trap dskThresholdLimit shows,
snmp-server trap dskThresholdLimit value
Number that represents the percentage of available disk space. The value ranges from 1 to 100. |
So, you would use something like 99 as the value instead of 1.
- Mark as New
- Bookmark
- Subscribe
- Mute
- Subscribe to RSS Feed
- Permalink
- Report Inappropriate Content
07-06-2017 04:24 PM
Thanks - that made a difference. The mystery is solved.
I wanted to provoke the trap to find the OID (it helps to know that ISE uses the Net-SNMP suite - in that case I managed to find the complete listing at Net-SNMP) - and they define "dskPercent" as 'Percentage of space used on disk'. This is how I expected it to work - makes more intuitive sense - if you want an SNMP trap to be sent when a volume is 10% used, then the value should be 10. The word "limit" implies an upper value .. as opposed to the concept of a remaining value, which is how ACS/ISE has chosen to implement this. Unnecessarily confusing - and as you can see, the SNMP trap contains the actual disk percentage used, and not its remaining value. What does CSCve86955 actually resolve?
On my MNT node I set
snmp-server trap dskThresholdLimit "99"
And with the disk output below I got the SNMP traps seen further below
sco8834ise050/admin# show disk
disk repository: 2% used (203644 of 14987616)
Internal filesystems:
/ : 16% used ( 2132304 of 14987616)
/dev : 0% used ( 0 of 32895148)
/dev/shm : 0% used ( 0 of 32905156)
/run : 1% used ( 796 of 32905156)
/sys/fs/cgroup : 0% used ( 0 of 32905156)
/tmp : 1% used ( 6544 of 1983056)
/boot : 23% used ( 103749 of 487634)
/storedconfig : 2% used ( 1582 of 95054)
/opt : 3% used ( 31205296 of 1212603984)
/run/user/440 : 0% used ( 0 of 6581032)
/run/user/301 : 0% used ( 0 of 6581032)
/run/user/321 : 0% used ( 0 of 6581032)
/run/user/0 : 0% used ( 0 of 6581032)
/run/user/304 : 0% used ( 0 of 6581032)
/run/user/303 : 0% used ( 0 of 6581032)
all internal filesystems have sufficient free space
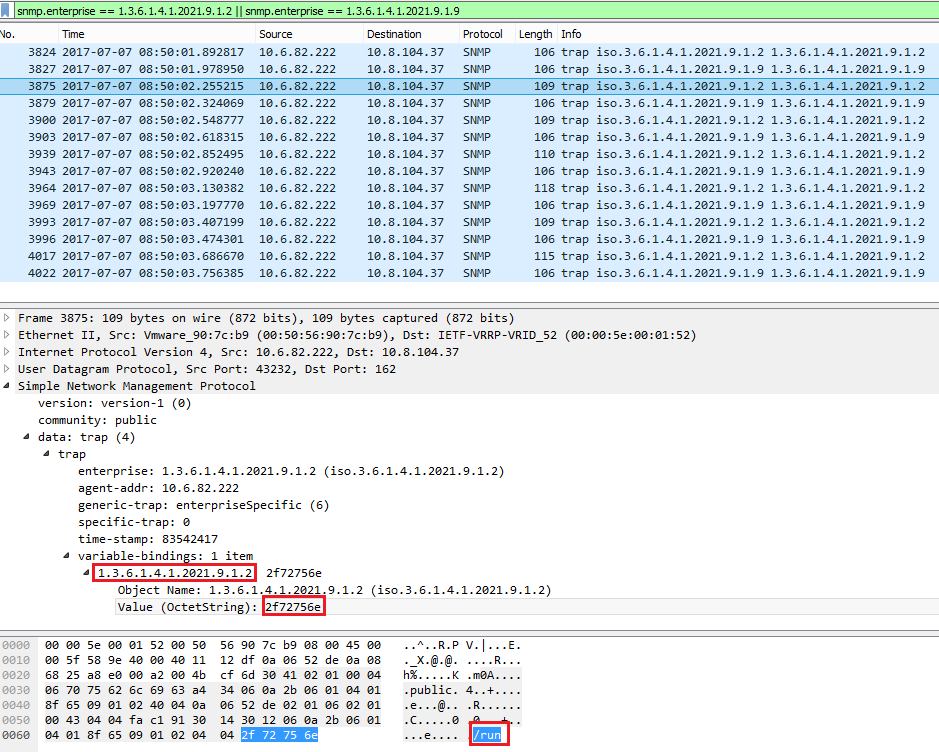
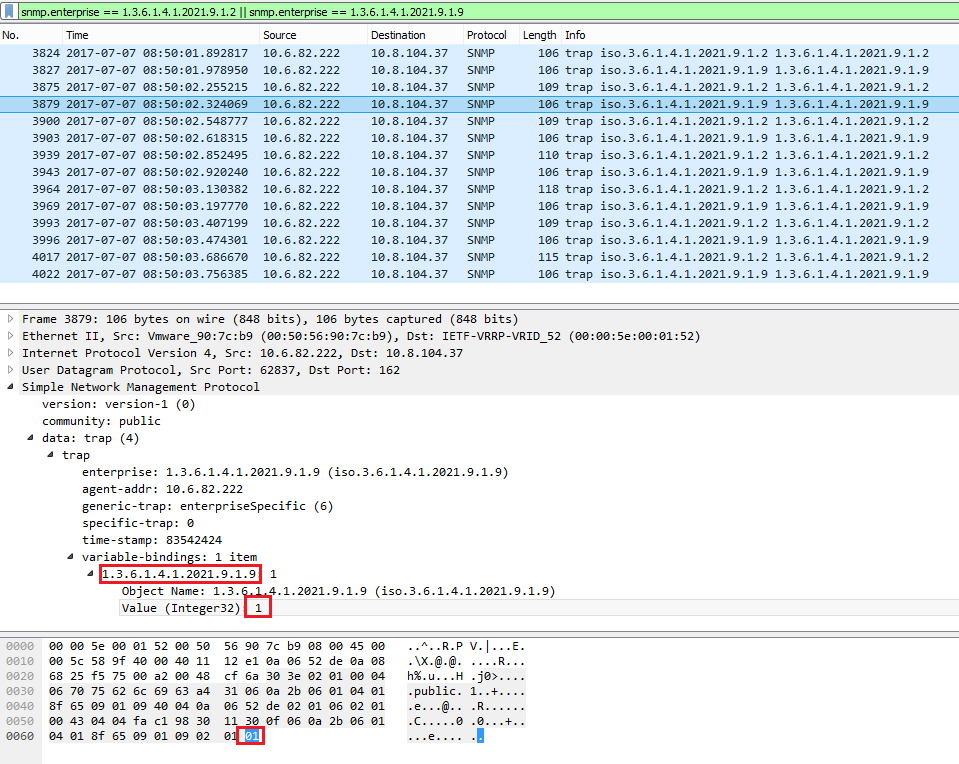
1.3.6.1.4.1.2021.9.1.2 contains the filesystem name (e.g. "/", "/tmp")
1.3.6.1.4.1.2021.9.1.9 contains the % used as seen in the show disk above
- Mark as New
- Bookmark
- Subscribe
- Mute
- Subscribe to RSS Feed
- Permalink
- Report Inappropriate Content
07-06-2017 04:30 PM
CSCve86955 is about the OID not available for SNMP GET in ISE 2.0.1+. And, if we manually define it in the snmpd.conf file and restart the daemon, the values are 2% lower than what we obtain from "df" command.
- Mark as New
- Bookmark
- Subscribe
- Mute
- Subscribe to RSS Feed
- Permalink
- Report Inappropriate Content
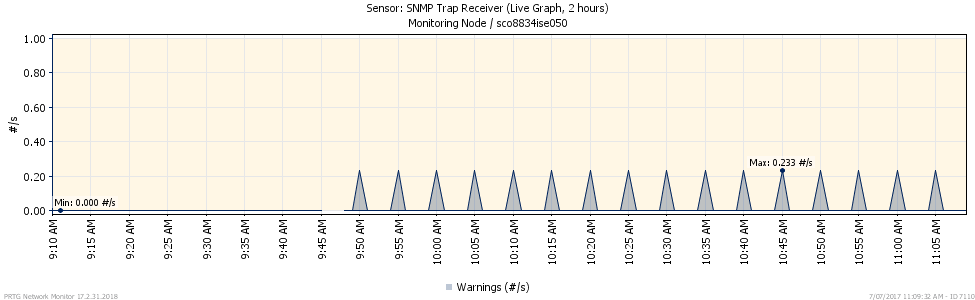
07-06-2017 06:12 PM
Success! My PRTG now shows the disk space warnings in regular 5 minute intervals. I only classified these two OID's at Warning level.
Discover and save your favorite ideas. Come back to expert answers, step-by-step guides, recent topics, and more.
New here? Get started with these tips. How to use Community New member guide