- Cisco Community
- Technology and Support
- Networking
- Network Management
- Cisco Prime LMS 4.2 AutoMonitoring Error
- Subscribe to RSS Feed
- Mark Topic as New
- Mark Topic as Read
- Float this Topic for Current User
- Bookmark
- Subscribe
- Mute
- Printer Friendly Page
Cisco Prime LMS 4.2 AutoMonitoring Error
- Mark as New
- Bookmark
- Subscribe
- Mute
- Subscribe to RSS Feed
- Permalink
- Report Inappropriate Content
01-22-2014 05:49 PM
We've recently installed LMS 4.2 on a Windows VM.
All devices have been auto discovered and added in. However the AutoMonitor failed to start with the following error:
AutoMonitoring Details
Problem with File /WEB-INF/screens/admin/AutoMonitoringDetails.jsp!!!java.lang.NullPointerException
And most sections under Monitor dashboard are displaying a database error:
Unable to get Database Connection. Either UPMDbEngine process is down or Connection Pool is exhausted.
I've run some self test and all came back with following two FAIL items.
FAIL SWAP Size in GB:9.0
FAIL Cisco Prime Installed Drive Size in GB: 50.0
Not sure whether this relates to the above errors that I got. Could someone please shed some lights on it?
BTW, I've restarted the UPMDbEngine process several times although it's already running and last night the Windows VM has been restarted as well.
- Labels:
-
Network Management
- Mark as New
- Bookmark
- Subscribe
- Mute
- Subscribe to RSS Feed
- Permalink
- Report Inappropriate Content
01-22-2014 10:15 PM
Please share the install log from the C:\ drive to check if install was clean.
Please check the following things :
1. Disable any Antivirus if installed on LMS server and restart Daemon Manager and see if it resolves.
2. Check Windows Event logs if any UPM related process error is noticed.
3. Being fresh install if it is not used much try to reinitialize the UPM database, following is the procedure :
a) Stop the Ciscoworks daemons
b) perl dbRestoreOrig.pl dsn=upm dmprefix=UPM
c) Start the Ciscoworks daemons
Note: The perl executable is found ../CSCOpx/bin/ as well as the dbRestoreOrig.pl script.
-Thanks
Vinod
**Rating Encourages contributors, and its really free. **
- Mark as New
- Bookmark
- Subscribe
- Mute
- Subscribe to RSS Feed
- Permalink
- Report Inappropriate Content
01-22-2014 10:31 PM
Thanks for the reply Vinod!
Tried 1 already before posting. No UPM related process error is noticed in event viewer however there is quite a few Apache Event ID 3299. Not sure whether it relates to database though.
The Apache service named reported the following error:
>>> [Thu Jan 23 16:47:14 2014] [warn] The Alias directive in D:/Win32app/CiscoWorks/MDC/Apache/conf/cmf-app.conf at line 8 will probably never match because it overlaps an earlier Alias. .
Will give it a go on 3 and post it back if it works.
Thanks.
- Mark as New
- Bookmark
- Subscribe
- Mute
- Subscribe to RSS Feed
- Permalink
- Report Inappropriate Content
01-22-2014 10:53 PM
Please share the output of pdshow -brief from your command prompt as well for us to see if all the processes are running fine.
Also, please share your D:/Win32app/CiscoWorks/MDC/Apache/conf/cmf-app.conf file for me to match it and see if the line 8 is correct or not.
-Thanks
Vinod
**Rating Encourages contributors, and its really free. **
- Mark as New
- Bookmark
- Subscribe
- Mute
- Subscribe to RSS Feed
- Permalink
- Report Inappropriate Content
01-23-2014 03:58 PM
Hi Vinod,
I've now completely finished the DFM database reset following your point 3 and this link below:
http://www.routerdiscussions.com/viewtopic.php?t=225&p=1245
The problem still exist. One weird thing I noticed since the beginning is when I expanded "All Devices" in some sections (e.g. Performance->Device->CPU Utilization) of the Report, it has no device listed while other sections have them listed (e.g. Inventory->Detailed Device).
Run the pdshow -brief after the db reset:
Process State Pid
******* ***** ***
UPMDbEngine Program started - No mgt msgs received 6680
UPMDbMonitor Administrator has shut down this server 0
Tomcat Program started - No mgt msgs received 9032
TomcatMonitor Running normally 10120
Apache Program started - No mgt msgs received 16068
TopoServer Program started - No mgt msgs received 12904
RMEDbEngine Program started - No mgt msgs received 16316
Proxy Program started - No mgt msgs received 8200
NameServer Program started - No mgt msgs received 8208
NameServiceMonitor Program started - No mgt msgs received 15416
EDS Running normally 14184
LicenseServer Program started - No mgt msgs received 11112
IpmDbEngine Program started - No mgt msgs received 2292
INVDbEngine Program started - No mgt msgs received 7896
FHPurgeTask Never started 0
FHDbEngine Program started - No mgt msgs received 6156
ESS Program started - No mgt msgs received 3208
EssMonitor Running normally 16612
EventFramework Program started - No mgt msgs received 4560
PMServer Running normally 4588
SyslogCollector Running normally 3056
EPMDbEngine Program started - No mgt msgs received 2372
EPMServer Running normally 1604
FHServer Running normally 4524
diskWatcher Running normally 2496
DFMMultiProcLogger Program started - No mgt msgs received 2384
DFMLogServer Program started - No mgt msgs received 3332
DFMCTMStartup Administrator has shut down this server 0
DfmBroker Running normally 2512
DfmServer Running normally 3644
DfmServer1 Running normally 1908
DCRDevicePoll Never started 0
CSSCPServer Program started - No mgt msgs received 3688
CSRegistryServer Running normally 2364
CSDiscovery Never started 0
CmfDbEngine Program started - No mgt msgs received 4972
CmfDbMonitor Running normally 4064
DCRServer Running normally 6000
CMFOGSServer Program started - No mgt msgs received 9124
EssentialsDM Running normally 7352
CAAMServer Running normally 13408
ConfigMgmtServer Running normally 13540
ConfigUtilityService Running normally 13788
ICServer Running normally 13656
EnergyWise Running normally 13332
PMCOGSServer Program started - No mgt msgs received 13944
IPMOGSServer Program started - No mgt msgs received 16760
TISServer Program started - No mgt msgs received 11124
DFMOGSServer Program started - No mgt msgs received 14036
InventoryCollector Running normally 12408
Interactor Program started - No mgt msgs received 14760
InventoryCollector1 Program started - No mgt msgs received 14516
Interactor1 Program started - No mgt msgs received 17048
NOSServer Running normally 10836
PTMServer Running normally 14792
UPMProcess Administrator has shut down this server 0
EDS-GCF Running normally 12264
jrm Running normally 12996
CTMJrmServer Running normally 16608
ChangeAudit Program started - No mgt msgs received 7976
SyslogAnalyzer Running normally 7980
DataPurge Administrator has shut down this server 0
IPMProcess Program started - No mgt msgs received 16816
ANIDbEngine Program started - No mgt msgs received 6172
ANIServer Running with busy flag set 6196
UTMajorAcquisition Never started 0
MACUHIC Running normally 15340
UTLITE Running normally 6244
UTManager Running normally 6708
VNMServer Program started - No mgt msgs received 6268
WlseUHIC Running normally 6280
AdapterServer1 Program started - No mgt msgs received 6720
AdapterServer Program started - No mgt msgs received 7052
And the D:/Win32app/CiscoWorks/MDC/Apache/conf/cmf-app.conf
SetEnvIf Request_URI /cwhp/servlet/AxisServlet allow_https
SetEnvIf Request_URI /cwhp/servlet/AxisServlet deny_http
SetEnvIf Request_URI /cwhp/services/ allow_https
SetEnvIf Request_URI /cwhp/services/ deny_http
Alias /CSCOcm/classpath/ "D:/Win32app/CISCOW~1/campus/www/classpath/"
SetEnvIf Request_URI "swimtemp" allow_http
SetEnvIf Request_URI "cwcli" allow_https
Alias /CSCOcm/classpath/ "D:/Win32app/CISCOW~1/campus/www/classpath/"
Thanks a lot!
")
")
- Mark as New
- Bookmark
- Subscribe
- Mute
- Subscribe to RSS Feed
- Permalink
- Report Inappropriate Content
01-23-2014 07:39 PM
Hi Bin,
Issue seems to be with the UPM database ,below processs are down:
UPMDbMonitor Administrator has shut down this server 0
UPMProcess Administrator has shut down this server 0
and which is why you are unable to get into the (performance >device>cpu utilization)
to fix it , Reintialize the UPM database as below:
stop the daemon manager (net stop crmdmgtd)
NMSROOT\bin\perl.exe NMSROOT\bin\dbRestoreOrig.pl dsn=upm dmprefix=UPMstart the daemon manager (net start crmdmgtd)
You can Safely remove this last line from cmf-app.conf:
Alias /CSCOcm/classpath/ "D:/Win32app/CISCOW~1/campus/www/classpath/"
Thanks-
Afroz
[Do rate the useful post]
- Mark as New
- Bookmark
- Subscribe
- Mute
- Subscribe to RSS Feed
- Permalink
- Report Inappropriate Content
01-23-2014 08:40 PM
Hi Afroj,
Thanks for noticing that. I didn't have a careful look when I pasting the output. This was generated soon after I started the daemon manager and when I saw your reply, both processes were running already.
But anyway, I did another reinitialization following your suggestion and removed the last line from cmf-app.conf. However, the problem still persists.
Most sections under Monitor are saying "Unable to get Database Connection. Either UPMDbEngine process is down or
Connection Pool is exhausted."
And the Device Selector under Reports->Performance has nothing to select from just like I haven't added in any devices. But I can still select them if I choose Reports->Inventory for example...
Are those different sections under Reports using the same Device List? Or did I miss something during setup?
Thanks~
- Mark as New
- Bookmark
- Subscribe
- Mute
- Subscribe to RSS Feed
- Permalink
- Report Inappropriate Content
01-23-2014 10:46 PM
- Mark as New
- Bookmark
- Subscribe
- Mute
- Subscribe to RSS Feed
- Permalink
- Report Inappropriate Content
01-25-2014 03:55 PM
Hi Afroj,
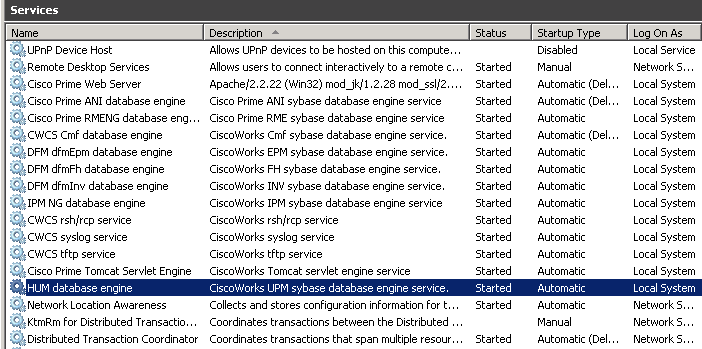
The HUM database service is running on the server. I just updated my original post with two log files that you mentioned.
And with the services screenshot of the server below.
I also contacted our local reseller support and they recommended using Cisco's pre-configured image file and deploy it on ESX server rather than my current setting on a Windows 2008 VM. Would you think that will make a difference?
Thanks.
- Mark as New
- Bookmark
- Subscribe
- Mute
- Subscribe to RSS Feed
- Permalink
- Report Inappropriate Content
01-25-2014 08:10 PM
so what I understand you are planning to reinstalled LMS ?
- Mark as New
- Bookmark
- Subscribe
- Mute
- Subscribe to RSS Feed
- Permalink
- Report Inappropriate Content
01-25-2014 11:10 PM
If the reseller support is unable to provide a solution, and if all the suggestion I got from here ends with negative results, yes.
I have limited knowledge in database, but I've found many people here are more specialized in this software.
- Mark as New
- Bookmark
- Subscribe
- Mute
- Subscribe to RSS Feed
- Permalink
- Report Inappropriate Content
01-26-2014 04:13 AM
Hi,
Logs looks fine. HUM database and the process also seems to be running fine.
It could be a port issue. what I would suggest is :
-change the STARTUP type of the Daemon Manager to MANUAL from AUTOMATIC
-reboot the server.
-Chnage the startup type back to AUTOMATIC
-Now start the services from the CLI ( net start crmdmgtd)
-wait for 10 -15 min..
-check the status of UPMDbEngine and UPM Process .. hope they are ok
-now check the issue...
Thanks-
Afroz
[Do Rate the useful post]
Discover and save your favorite ideas. Come back to expert answers, step-by-step guides, recent topics, and more.
New here? Get started with these tips. How to use Community New member guide