- Cisco Community
- Technology and Support
- Networking
- Network Management
- SNMP statistics for GRE Tunnel interface statistics - not possib
- Subscribe to RSS Feed
- Mark Topic as New
- Mark Topic as Read
- Float this Topic for Current User
- Bookmark
- Subscribe
- Mute
- Printer Friendly Page
SNMP statistics for GRE Tunnel interface statistics - not possible during the day
- Mark as New
- Bookmark
- Subscribe
- Mute
- Subscribe to RSS Feed
- Permalink
- Report Inappropriate Content
03-29-2013 11:10 AM
Hello !
We use Cacti to get interfaces statistics of a ASR1002 router (version 03.04.02.S.151-3.S2).
A new GRE tunnel has been created, but unfortunately we are not able to get basic interface average during the day.
What is surprising is the fact the graphs are built on the night only.
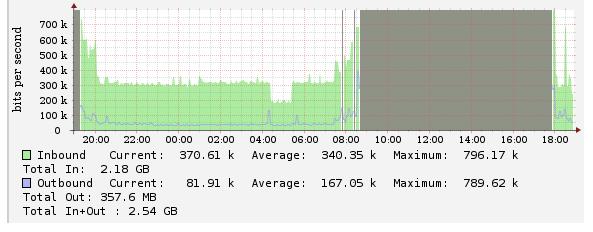
It seems as soon as we exceed some level of Bandwidth (~ 700-800k) the tool does not get the information
The OID I try to get are ifHCInOctets (.1.3.6.1.2.1.31.1.1.1.6) and ifHCOutOctets (.1.3.6.1.2.1.31.1.1.1.10) and some other interface statistics for both 64 and 32 bits.
I am wondering if the default BW of 100kbit/sec for the Tu0 is playing a role here =>
=========================================
Tunnel0 is up, line protocol is up
Hardware is Tunnel
Internet address is 172.18.70.73/30
MTU 17916 bytes, BW 100 Kbit/sec, DLY 50000 usec,
reliability 255/255, txload 255/255, rxload 255/255
Encapsulation TUNNEL, loopback not set
Keepalive set (5 sec), retries 3
Tunnel source X.X.X.X, destination X.X.X.X
Tunnel protocol/transport GRE/IP
Key disabled, sequencing disabled
Checksumming of packets disabled
Tunnel TTL 255, Fast tunneling enabled
Tunnel transport MTU 1476 bytes
Tunnel transmit bandwidth 8000 (kbps)
Tunnel receive bandwidth 8000 (kbps)
Last input never, output 18:34:15, output hang never
Last clearing of "show interface" counters never
30 second input rate 5423000 bits/sec, 616 packets/sec
30 second output rate 864000 bits/sec, 468 packets/sec
=========================================
Does someone has encountered this issue before.
Any suggestion would be much appreciated.
Best regards.
Oliv.
- Labels:
-
Network Management
- Mark as New
- Bookmark
- Subscribe
- Mute
- Subscribe to RSS Feed
- Permalink
- Report Inappropriate Content
05-12-2013 11:39 PM
Hello.
You have solved this problem?
- Mark as New
- Bookmark
- Subscribe
- Mute
- Subscribe to RSS Feed
- Permalink
- Report Inappropriate Content
05-22-2013 08:14 AM
Hello,
It was an issue on the Cacti side. After the Cacti team has recreated the graph, the issue has been fixed.
Best regards.
Oliv.
- Mark as New
- Bookmark
- Subscribe
- Mute
- Subscribe to RSS Feed
- Permalink
- Report Inappropriate Content
11-04-2019 10:38 PM
Hello,
I think it is a common issue for CACTI and some virtual interfaces.
When Cacti generates DataSource as it described in DataQueries it uses |query_ifSpeed| for rrd_maximum field of the DataSource. Then somthing going wrong with interface speed determination.
In this case problem in the "SNMP - Interface Statistics" DataQuerу. And you can try to remove rule for the rrd_maximum field.
- Mark as New
- Bookmark
- Subscribe
- Mute
- Subscribe to RSS Feed
- Permalink
- Report Inappropriate Content
09-05-2022 02:55 AM
Hi Oliv,
Cacti will get interface bandwidth from the router which in this case is 8Mbps. Any traffic above that will not be represented on the graph.
Solution to this is:
a) find which .rrd file corresponds to this graph
b) ssh to cacti server and go to /usr/share/cacti/site/rra
c) Run the 2 commands below for each Tunnel interface graph (to set graph both incoming and outgoing limit to 400 Mbps):
rrdtool tune <your-rrd-name>.rrd -a traffic_in:400000000
rrdtool tune <your-rrd-name>.rrd -a traffic_out:400000000
Discover and save your favorite ideas. Come back to expert answers, step-by-step guides, recent topics, and more.
New here? Get started with these tips. How to use Community New member guide