- Cisco Community
- Technology and Support
- Security
- Network Security
- ASA 5525X with 9.1(2) IOS version Memory grow issue
- Subscribe to RSS Feed
- Mark Topic as New
- Mark Topic as Read
- Float this Topic for Current User
- Bookmark
- Subscribe
- Mute
- Printer Friendly Page
ASA 5525X with 9.1(2) IOS version Memory grow issue
- Mark as New
- Bookmark
- Subscribe
- Mute
- Subscribe to RSS Feed
- Permalink
- Report Inappropriate Content
06-08-2013 12:14 PM - edited 03-11-2019 06:54 PM
Hi,
So, finnaly i have installed two 5525X firewals in A/S failover.
working fine, CPU is ok.
memory behave very strange. it is growing day by day. i have a week already firewalls installed and the memory grew from 20 % to 51 %
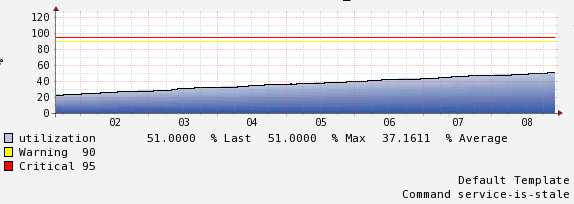
CPU is arrounf 20- 30 % durring the day, and 3 % during the night. RAM is just kiling me. if it grows so, i will need to reload it after a week.
here is the output from the stanby firewall:
fw01# failover exec mate sh memory
Free memory: 3275200112 bytes (76%)
Used memory: 1019767184 bytes (24%)
------------- ------------------
Total memory: 4294967296 bytes (100%)
I have also attached log from show memory details
- Labels:
-
NGFW Firewalls
- Mark as New
- Bookmark
- Subscribe
- Mute
- Subscribe to RSS Feed
- Permalink
- Report Inappropriate Content
06-10-2013 11:34 AM
I would go the CLI and issue a "show process memory" and look for the process that has all the memory allocated. You might want to do this over time to see which process is constantly allocating more memory. Then I would go to the bug tool kit and see if I could find a known bug. If not, take the information you just gathered and open a case with TAC
- Mark as New
- Bookmark
- Subscribe
- Mute
- Subscribe to RSS Feed
- Permalink
- Report Inappropriate Content
06-11-2013 12:14 AM
- Mark as New
- Bookmark
- Subscribe
- Mute
- Subscribe to RSS Feed
- Permalink
- Report Inappropriate Content
06-11-2013 06:14 AM
Ok I guess I was not clear about what this is telling me. I thought that the Allocated column indicated how much memory the process currently has allocated. Clearly this can't be the case, or your DATAPATH process would have over 3 terrabytes allocated. So it must be that subtracting freed bytes from allocated bytes gives you the current allocatioon, correct? Except that if that were true your DATAPATH process has freed more memory than it has ever allocated. This is true of some other processes as well. Perhaps there is some glitch in reporting.
Ok having said all that your listen/ssh process looks suspicions to me. Subtracting freed from allocated leaves a value of over 5 gigabytes. And there are 2 active bugs relating to SSH processing and memory leaks, CSCts58514 and CSCts58520. Version 9.1(2) is not listed as a known affected version, but that doesn't necessarily mean that it isn't affected.
I see 44 ASA bugs related to memory leaks that have been modified since January of this year. I see only one that specifically has 9.1(2) listed, CSCuh34147. That has to do with a 3K leak every time you do a show tech support. The bottom line is you are going to need to open a TAC case to find out which one you have.
Good luck.
- Mark as New
- Bookmark
- Subscribe
- Mute
- Subscribe to RSS Feed
- Permalink
- Report Inappropriate Content
06-11-2013 07:02 AM
Hi,
It might be something related to SSH.
Since couple of hours i am not able to log via ssh to the router. lucky i have console to it.
I can ssh to stanby asa, strage but i was disconnected twice already from stanby.
I will disable ssh version 2.
The point is that i cannot log also via telnet and asdm (enabled them thinking it might give me possibility to log to firewall).
Related to TAC, unfortunately, my company does not have support for this firewalls. when i try to log a case to TAC, i need to secify the serial number, and cisco tells that the serial number i provide is not under support (or something like this).
I was thinking to downgrade it to 9.1.1 or to 9.0.2, but if it might not help.
There are two processes that consume memory (more allocated)
| IP Background |
CP Processing
I have read somewhere that CP processing includes Thread Detection and packet inspection ..... i do not have thread detection configured. i will try to remove as much inspection as i have.related to ip background, i do not knwo. last week I found a VM generated a lot of Multicast (50 Mbps) and as was droping it. after stopign the Multicast, CPU decreased, but not RAM. so, no ideas. also, i have port channel configured (g0/0 and g0/1)
I plan to restart the firewall on saturday. probably downgrade it or move it on standby. The stabdby firewall has the memory working fine.
- Mark as New
- Bookmark
- Subscribe
- Mute
- Subscribe to RSS Feed
- Permalink
- Report Inappropriate Content
06-11-2013 07:07 AM
also, related to SSH,
When i issue command:
fw01(config)# sh asp table socket
Protocol Socket State Local Address Foreign Address
SSL 000036b8 LISTEN XXX.XXX.XXX.XXX:443 0.0.0.0:*
SSL 00004ab8 LISTEN XXX.XXX.XXX.XXX:443 0.0.0.0:*
SSL 00006228 LISTEN XXX.XXX.XXX.XXX:443 0.0.0.0:*
SSL 008c6b28 LISTEN XXX.XXX.XXX.XXX:443 0.0.0.0:*
no ssh or telnet listening.
- Mark as New
- Bookmark
- Subscribe
- Mute
- Subscribe to RSS Feed
- Permalink
- Report Inappropriate Content
06-11-2013 07:32 AM
That is interesting. What do you see on the standby firewall? Are there SSH sockets open?
- Mark as New
- Bookmark
- Subscribe
- Mute
- Subscribe to RSS Feed
- Permalink
- Report Inappropriate Content
06-11-2013 07:42 AM
yes,
the sockets are opened on standby firewall. i was able to log on it:
Protocol Socket State Local Address Foreign Address
SSL 00011948 LISTEN x:443 0.0.0.0:*
SSL 00013578 LISTEN x:443 0.0.0.0:*
SSL 00014278 LISTEN x:443 0.0.0.0:*
SSL 00017ee8 LISTEN x:443 0.0.0.0:*
TCP 00021308 LISTEN x:23 0.0.0.0:*
TCP 00033af8 LISTEN x:22 0.0.0.0:*
TCP 000359f8 LISTEN x:22 0.0.0.0:*
TCP 00036068 LISTEN x:22 0.0.0.0:*
TCP 00038aa8 LISTEN x:22 0.0.0.0:*
TCP 000421b8 ESTAB x:22 x:50842
- Mark as New
- Bookmark
- Subscribe
- Mute
- Subscribe to RSS Feed
- Permalink
- Report Inappropriate Content
06-12-2013 01:54 AM
Hi,
RAM stopped at 60%. from yesterday evening it did not rised.
I also have OSPF working on one of the interfaces. ASA was DR in the broadcast network.
I made asa as 2WAY/DROTHER, and the memory does not rise. anywhere, i still do not have ssh access. i will reload it in the weekend.
Thanks
- Mark as New
- Bookmark
- Subscribe
- Mute
- Subscribe to RSS Feed
- Permalink
- Report Inappropriate Content
06-24-2013 12:37 AM
Hi,
I belive this is because of Management beeing eabled. it stopped to rise when router stopped listening on SSH, HTTP or telnet ports.
I have restarted the router and after that RAM is rising again. currently it is on 57 %. i am waiting untill 60%, like last time. for sure everything is related to RAM and Management vty lines Bugs.
I am waiting for new software releases. Cisco has already 1.5 month untill they released 9.1.2 software. hope in a month Cisco will release another software with this BUG solved.
thanks
Discover and save your favorite ideas. Come back to expert answers, step-by-step guides, recent topics, and more.
New here? Get started with these tips. How to use Community New member guide
