- Cisco Community
- Technology and Support
- Security
- Network Security
- How to See ALLLLLLL ASA Logging?
- Subscribe to RSS Feed
- Mark Topic as New
- Mark Topic as Read
- Float this Topic for Current User
- Bookmark
- Subscribe
- Mute
- Printer Friendly Page
How to See ALLLLLLL ASA Logging?
- Mark as New
- Bookmark
- Subscribe
- Mute
- Subscribe to RSS Feed
- Permalink
- Report Inappropriate Content
04-14-2015 01:25 PM - edited 03-11-2019 10:46 PM
I use the packet tracer a lot for testing things like NAT and ACLs. But sometimes I just want to see everything flying through the firewall like I'm looking at The Matrix. If I choose monitor -> debugging I'm thinking I should see EVERYTHING going through the firewall and I'm not. For example, I'm trying to troubleshoot access to an external website and it's currently hard to differentiate if the issue is on my end or theirs. I have rules permitting the traffic and normally we use the logs for identifying traffic that the firewall blocks. But in this case I want to see that the traffic is permitted. That way I can hand it off saying it's through the firewall and the troubleshooting needs to continue further on down stream. How do I do this? Do I have to write a rule that denies all traffic explicitly and log it with level debugging to have it appear in the monitor -> debugging output? If I choose monitor -> debugging I'm thinking I'm going to get all traffic no matter where it's coming from or going to, but perhaps it's only showing me traffic that matches rules that I specifically setup to log at that level? I'm looking for a feature that is similar to Checkpoint where you open a window and it logs EVERYTHING. Just sit and watch ... I understand it probably has some buffer issues/constraints, and maybe I need to enable the sending of all debug to syslog and watch that? Or perhaps I can console in and turn on some monitoring that will show me the output in real time? I do not have any log messages disabled. My 'show logging' looks like this:
Syslog logging: enabled
Facility: 23
Timestamp logging: enabled
Standby logging: enabled
Debug-trace logging: disabled
Console logging: level debugging, 3612705 messages logged
Monitor logging: level debugging, 2204119164 messages logged
Buffer logging: level debugging, 5143173 messages logged
Trap logging: level warnings, facility 23, 98464495 messages logged
Logging to <interface name/IP removed> errors: 17339 dropped: 436653
History logging: level informational, 1604857491 messages logged
Device ID: disabled
Mail logging: disabled
ASDM logging: level debugging, 1606049868 messages logged
Regards,
Scott
- Labels:
-
NGFW Firewalls
")
")
- Mark as New
- Bookmark
- Subscribe
- Mute
- Subscribe to RSS Feed
- Permalink
- Report Inappropriate Content
04-14-2015 01:56 PM
If you're trying to debug connectivity issue to a particular website, the simplest thing (after verifying your basic ruleset and checking your logic with packet-tracer) is to perform a packet capture narrowed down to the destination host in question. ASDM has a wizard for that.
Grab a capture and you should see the traffic coming in, traffic going out, and return traffic (if any). Fire up a connection from your test machine and watch for the TCP 3-way handshake. If the website is accessed via http, you can also watch the GET requests and replies.
- Mark as New
- Bookmark
- Subscribe
- Mute
- Subscribe to RSS Feed
- Permalink
- Report Inappropriate Content
04-14-2015 01:58 PM
Marvin -
That's certainly an option, but a bit more effort than opening up the logging, creating a quick filter, and checking for what the firewall says when I click the refresh link on the website. Is there no way to see the traffic going through the firewall in real time if it's a rule violation? I'm looking for line items that show the connection is permitted and hand it off.
- Mark as New
- Bookmark
- Subscribe
- Mute
- Subscribe to RSS Feed
- Permalink
- Report Inappropriate Content
04-14-2015 02:13 PM
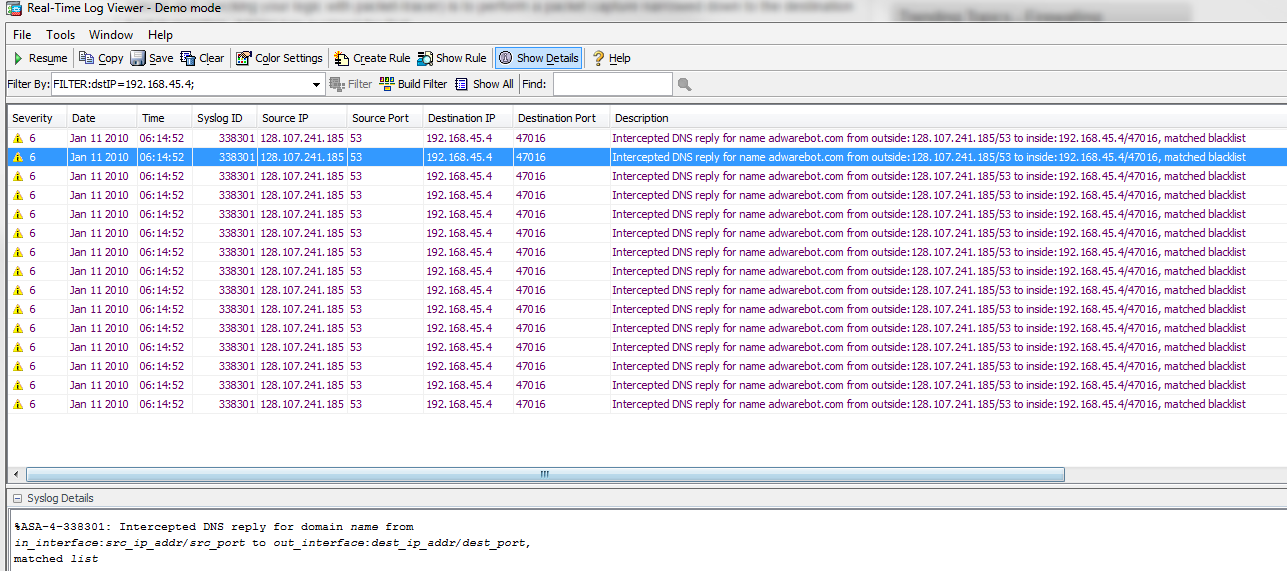
Sorry - yes, with your log settings you should be able to go in ASDM to Monitor, Logging, Real Time Log Viewer. You can then filter that by source address, destination address etc.
Here's an example from an ASDM in Demo mode (open image in new tab to zoom):
- Mark as New
- Bookmark
- Subscribe
- Mute
- Subscribe to RSS Feed
- Permalink
- Report Inappropriate Content
04-14-2015 02:42 PM
Just to add, there are many generic logging that are disabled on firewall.
If you do "show run all logging", you can verify that.
If you see disabled syslog ID you can check meaning of it and see if you want see it or not on your logging page.
However, you must always be aware of the potential impact of generating so much of syslog
- Mark as New
- Bookmark
- Subscribe
- Mute
- Subscribe to RSS Feed
- Permalink
- Report Inappropriate Content
04-15-2015 01:05 AM
Hi,
I think the when you say all events on the ASA device , you can apply this configuration on the ASA device:-
ASDM set to debugging :- This has been done
Also , if you want to see all the traffic being allowed or denied by the ASA device using ACL , you can use "log" keyword at the end of the ACE.
Refer:-
http://www.cisco.com/c/en/us/td/docs/security/asa/syslog-guide/messages/Syslog_Guide/msg-100000-series.html
Thanks and Regards,
Vibhor Amrodia
- Mark as New
- Bookmark
- Subscribe
- Mute
- Subscribe to RSS Feed
- Permalink
- Report Inappropriate Content
05-01-2015 06:15 AM
Vibhor -
I add 'debugging' level to my logs and leave the default interval of 300 sec (5 minutes). Is this too long of an interval to catch traffic? For example, I have a rule permitting outbound traffic for a specific host to all 'ip' traffic. I'd like to see what traffic that host is using and then scale it back. So I have a rule configured with logging every 30 seconds. I allowed the rule to run for a bit and I see that I have 2 hits. So I right click on the rule and view the log. The log is empty. What?
- Mark as New
- Bookmark
- Subscribe
- Mute
- Subscribe to RSS Feed
- Permalink
- Report Inappropriate Content
05-01-2015 07:27 PM
Hi,
I think you need to verify the "show run all logging" output first as I think there might be some syslog which might still be disabled.
Also , which default interval (5 Minutes) are you referring to ?
Thanks and Regards,
Vibhor Amrodia
- Mark as New
- Bookmark
- Subscribe
- Mute
- Subscribe to RSS Feed
- Permalink
- Report Inappropriate Content
05-04-2015 05:50 AM
Discover and save your favorite ideas. Come back to expert answers, step-by-step guides, recent topics, and more.
New here? Get started with these tips. How to use Community New member guide
