Introduction
If you have been using APIC-EM for a little while, you are probably wondering about getting extra information from devices.
CommandRunner is a new application on APIC-EM that allows you to run multiple commands (currently max of 5 at a time) on a number of devices.
Naturally, this is exposed through an API and this blog looks at some tools to use that API.
API
The API for CommandRunner are quite simple. There is a POST request that provides a list of deviceIds and commands to run.
The response will be a task
|
{
"response": {
"taskId": "c563edd1-8932-4da4-aa37-c7cc9dbb3a10",
"url": "/api/v1/task/c563edd1-8932-4da4-aa37-c7cc9dbb3a10"
},
"version": "1.0"
|
You then need to get the task body, to find a file containing the output.
|
https://adam-iwan/api/v1/task/c563edd1-8932-4da4-aa37-c7cc9dbb3a10 GET
"response": {
"version": 1487283738594,
"progress": "{\"fileId\":\"2d316e98-2667-4a6e-a084-6e039a5817be\"}",
"startTime": 1487283736972,
"endTime": 1487283738595,
"username": "admin",
"serviceType": "Network Poller Service",
"isError": false,
"lastUpdate": 1487283738594,
"rootId": "c563edd1-8932-4da4-aa37-c7cc9dbb3a10",
"id": "c563edd1-8932-4da4-aa37-c7cc9dbb3a10"
},
"version": "1.0"
}
|
Then get the file body to see the contents
|
https://adam-iwan/api/v1/file/2d316e98-2667-4a6e-a084-6e039a5817be GET
[{
"deviceUuid": "068e3625-b413-42b4-a07d-134081c1ff01",
"commandResponses": {
"SUCCESS": {
"show ver | inc IOS-XE Soft": "Cisco IOS Software, IOS-XE Software, Catalyst L3 Switch Software (CAT3K_CAA-UNIVERSALK9-M), Version 03.06.05E RELEASE SOFTWARE (fc2)\n"
},
"BLACKLISTED": {},
"FAILURE": {}
}
}]
|
Installation
The tools are published at the following repository https://github.com/aradford123/APIC-Command-Runner
Instructions for installing on a MAC/Linux machine follow:
Then i recommend creating a virtualenv
|
cd APIC-Command-Runner
virtualenv -p python3 env
source env/bin/activate
|
Remember, if you exit your shell or logout, you will need to run the command "source env/bin/activate" each time to activate the virtual environment.
Finally you need to install the uniq library. NOTE: If you have this already, you need version 1.4
|
pip install –r requirements.txt
|
Examples
To run the script you need to add your controller and the credentials for it. You can do this in two ways:
- edit the apic_config.py file
- use the APIC, APIC_USER and APIC_PASSWORD environment variables. For example the shell command "export APIC='sandboxapic.cisco.com'" would set the controller to the DevNet cloud controller. Be very careful with quotes. Here is an example of a file containing all of the variables.
|
$ cat env_vars
export APIC="apic-em"
export APIC_USER="admin"
export APIC_PASSWORD="password"
$ source ./env_vars
|
If you run the script without any augments you will get a list of valid commands.
|
$ ./cmd_runner.py
tag: None
no ips or tags for network devices
ValidCommands: call-home, cd, cping, crypto, dir, eping, grep, help, mediatrace, monitor, more, mping, mstat, ping, pwd, sdlc, show, standby, start-chat, systat, tarp, test, traceroute, ucse, verify, where, which-route
|
The cmd_runner.py script runs a command on one or more devices. Devices can be specified by IP address or tag.
|
$ ./cmd_runner.py --ip 192.168.14.16 --command "show clock"
tag: None
['show clock']
[
{
"commandResponses": {
"FAILURE": {},
"BLACKLISTED": {},
"SUCCESS": {
"show clock": "20:44:40.509 UTC Sat Feb 25 2017"
}
},
"deviceUuid": "5abffd04-f981-46be-8640-789af2e910d6"
}
]
|
The response shows you the devices that were successful, those that failed, and those commands that are blacklisted.
You can run a command on all devices with a certain tag. When the 1.4 release came out, you need to find out the version of NBAR protocol pack on the devices. I have tagged my IWAN devices with the tag "iwan", so the command will run on all of them. The "—human" option just displays the managementIpAddress of the device, and the output.
|
$ ./cmd_runner.py --tag iwan --command 'show ip nbar protocol-pack active | inc Ver' --human
tag: iwan
['show ip nbar protocol-pack active | inc Ver']
- 192.168.3.129: show ip nbar protocol-pack active | inc Ver:
Version: 28.0
NBAR Engine Version: 23
{}
- 192.168.13.1: show ip nbar protocol-pack active | inc Ver:
Version: 28.0
NBAR Engine Version: 23
{}
- 10.10.3.13: show ip nbar protocol-pack active | inc Ver:
Version: 28.0
NBAR Engine Version: 23
{}
- 10.10.2.13: show ip nbar protocol-pack active | inc Ver:
Version: 28.0
NBAR Engine Version: 23
{}
|
You can also use this API to run "test" commands:
|
$ ./cmd_runner.py --tag switch --command 'test cable-diagnostics tdr interface g1/0/1' --human
tag: switch
['test cable-diagnostics tdr interface g1/0/1']
- 10.10.2.130: test cable-diagnostics tdr interface g1/0/1:
TDR test started on interface Gi1/0/1
A TDR test can take a few seconds to run on an interface
Use 'show cable-diagnostics tdr' to read the TDR results.
{}
- 192.168.12.160: test cable-diagnostics tdr interface g1/0/1:
TDR test started on interface Gi1/0/1
A TDR test can take a few seconds to run on an interface
Use 'show cable-diagnostics tdr' to read the TDR results.
{}
- 10.10.14.2: test cable-diagnostics tdr interface g1/0/1:
TDR test started on interface Gi1/0/1
A TDR test can take a few seconds to run on an interface
Use 'show cable-diagnostics tdr' to read the TDR results.
{}
- 192.168.14.16: test cable-diagnostics tdr interface g1/0/1:
TDR test started on interface Gi1/0/1
A TDR test can take a few seconds to run on an interface
Use 'show cable-diagnostics tdr' to read the TDR results.
{}
- 10.10.10.110: test cable-diagnostics tdr interface g1/0/1:
TDR test started on interface Gi1/0/1
A TDR test can take a few seconds to run on an interface
Use 'show cable-diagnostics tdr' to read the TDR results.
{}
|
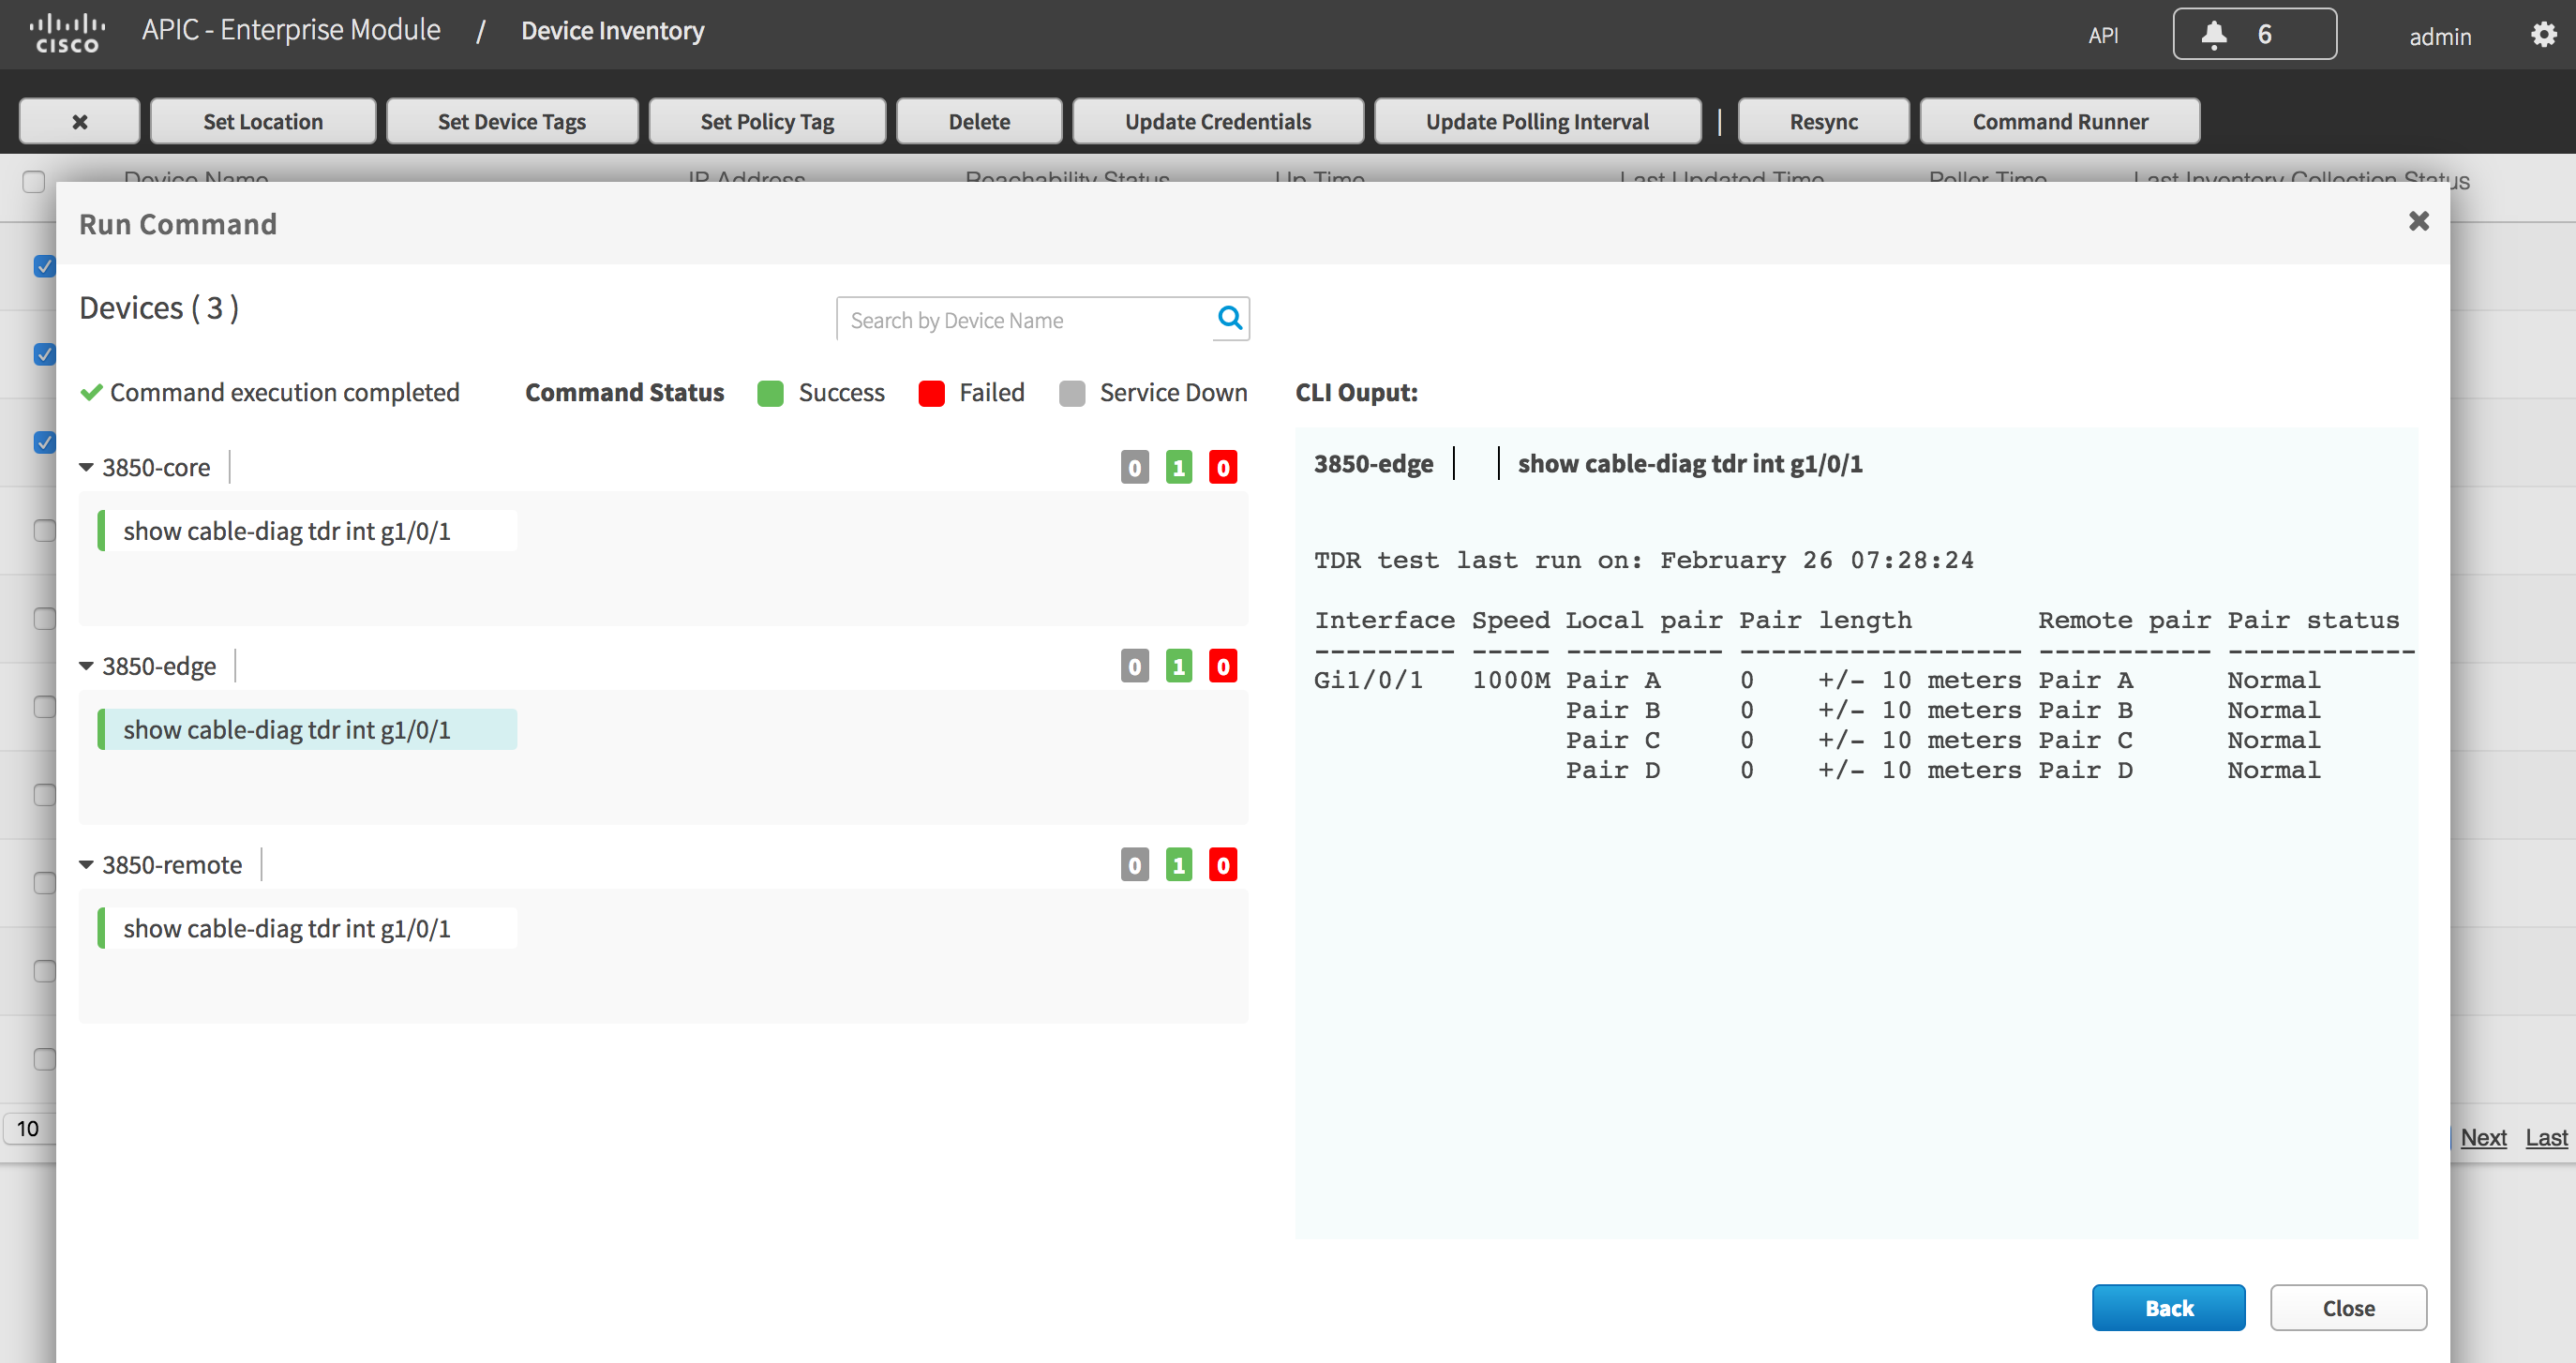
You then need to run the "show command" to get the results.
|
$ ./cmd_runner.py --tag switch --command 'show cable-diagnostics tdr interface g1/0/1' --human
tag: switch
['show cable-diagnostics tdr interface g1/0/1']
- 192.168.12.160: show cable-diagnostics tdr interface g1/0/1:
TDR test last run on: February 25 21:13:42
Interface Speed Local pair Pair length Remote pair Pair status
--------- ----- ---------- ------------------ ----------- --------------------
Gi1/0/1 1000M Pair A 33 +/- 10 meters Pair A Normal
Pair B 33 +/- 10 meters Pair B Normal
Pair C 33 +/- 10 meters Pair C Normal
Pair D 33 +/- 10 meters Pair D Normal
{}
- 192.168.14.16: show cable-diagnostics tdr interface g1/0/1:
TDR test last run on: February 25 21:13:42
Interface Speed Local pair Pair length Remote pair Pair status
--------- ----- ---------- ------------------ ----------- --------------------
Gi1/0/1 1000M Pair A 25 +/- 10 meters Pair A Normal
Pair B 25 +/- 10 meters Pair B Normal
Pair C 25 +/- 10 meters Pair C Normal
Pair D 25 +/- 10 meters Pair D Normal
{}
- 10.10.10.110: show cable-diagnostics tdr interface g1/0/1:
TDR test last run on: February 25 21:13:42
Interface Speed Local pair Pair length Remote pair Pair status
--------- ----- ---------- ------------------ ----------- --------------------
Gi1/0/1 1000M Pair A 0 +/- 10 meters Pair B Normal
Pair B 0 +/- 10 meters Pair A Normal
Pair C 0 +/- 10 meters Pair D Normal
Pair D 0 +/- 10 meters Pair C Normal
{}
- 10.10.2.130: show cable-diagnostics tdr interface g1/0/1:
TDR test last run on: February 25 21:13:42
Interface Speed Local pair Pair length Remote pair Pair status
--------- ----- ---------- ------------------ ----------- --------------------
Gi1/0/1 1000M Pair A 0 +/- 10 meters Pair A Normal
Pair B 0 +/- 10 meters Pair B Normal
Pair C 0 +/- 10 meters Pair C Normal
Pair D 0 +/- 10 meters Pair D Normal
{}
- 10.10.14.2: show cable-diagnostics tdr interface g1/0/1:
TDR test last run on: February 25 21:13:42
Interface Speed Local pair Pair length Remote pair Pair status
--------- ----- ---------- ------------------ ----------- --------------------
Gi1/0/1 1000M Pair A 0 +/- 10 meters Pair A Normal
Pair B 0 +/- 10 meters Pair B Normal
Pair C 0 +/- 10 meters Pair C Normal
Pair D 0 +/- 10 meters Pair D Normal
{}
|
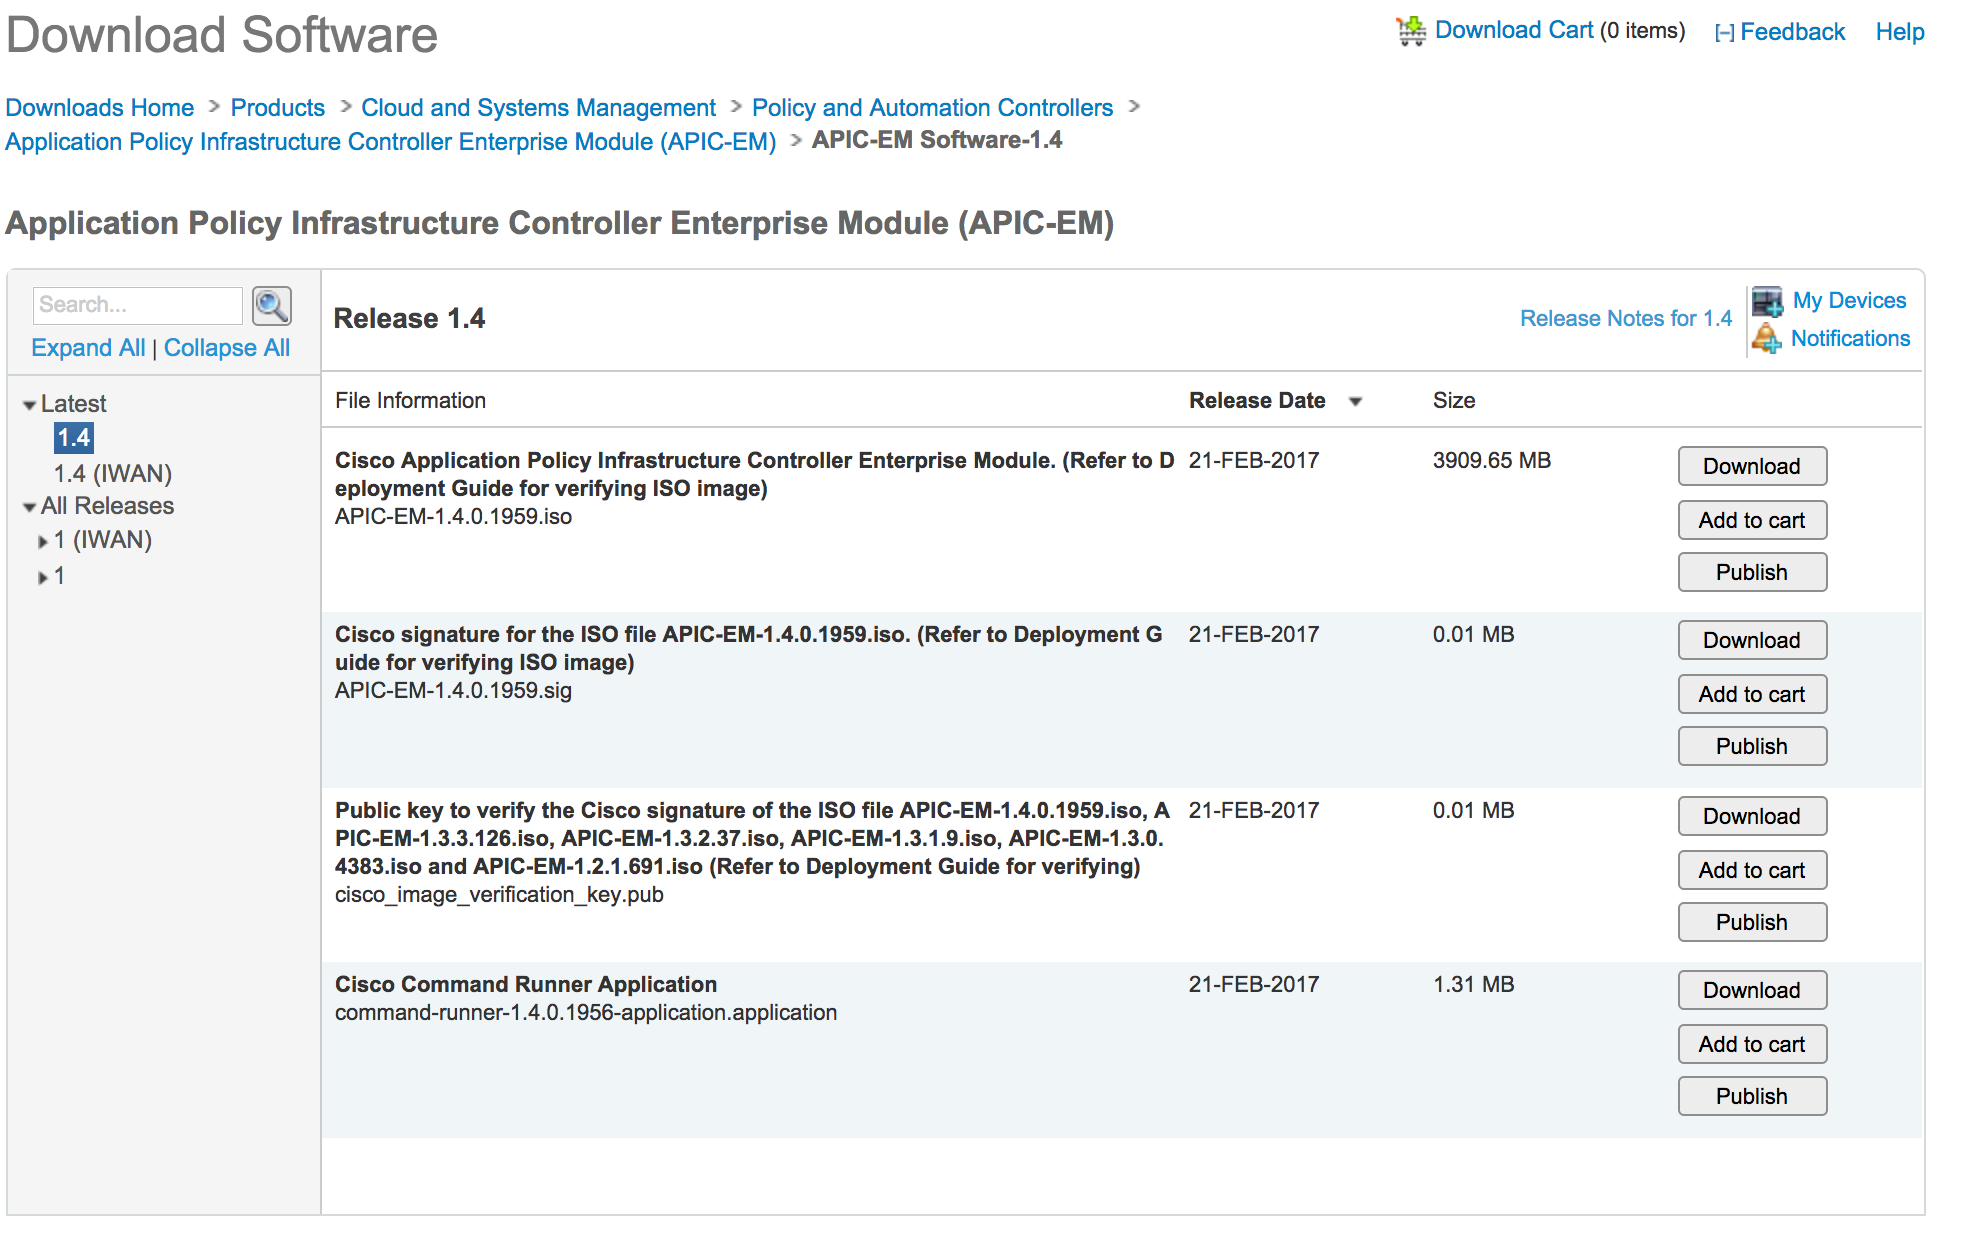
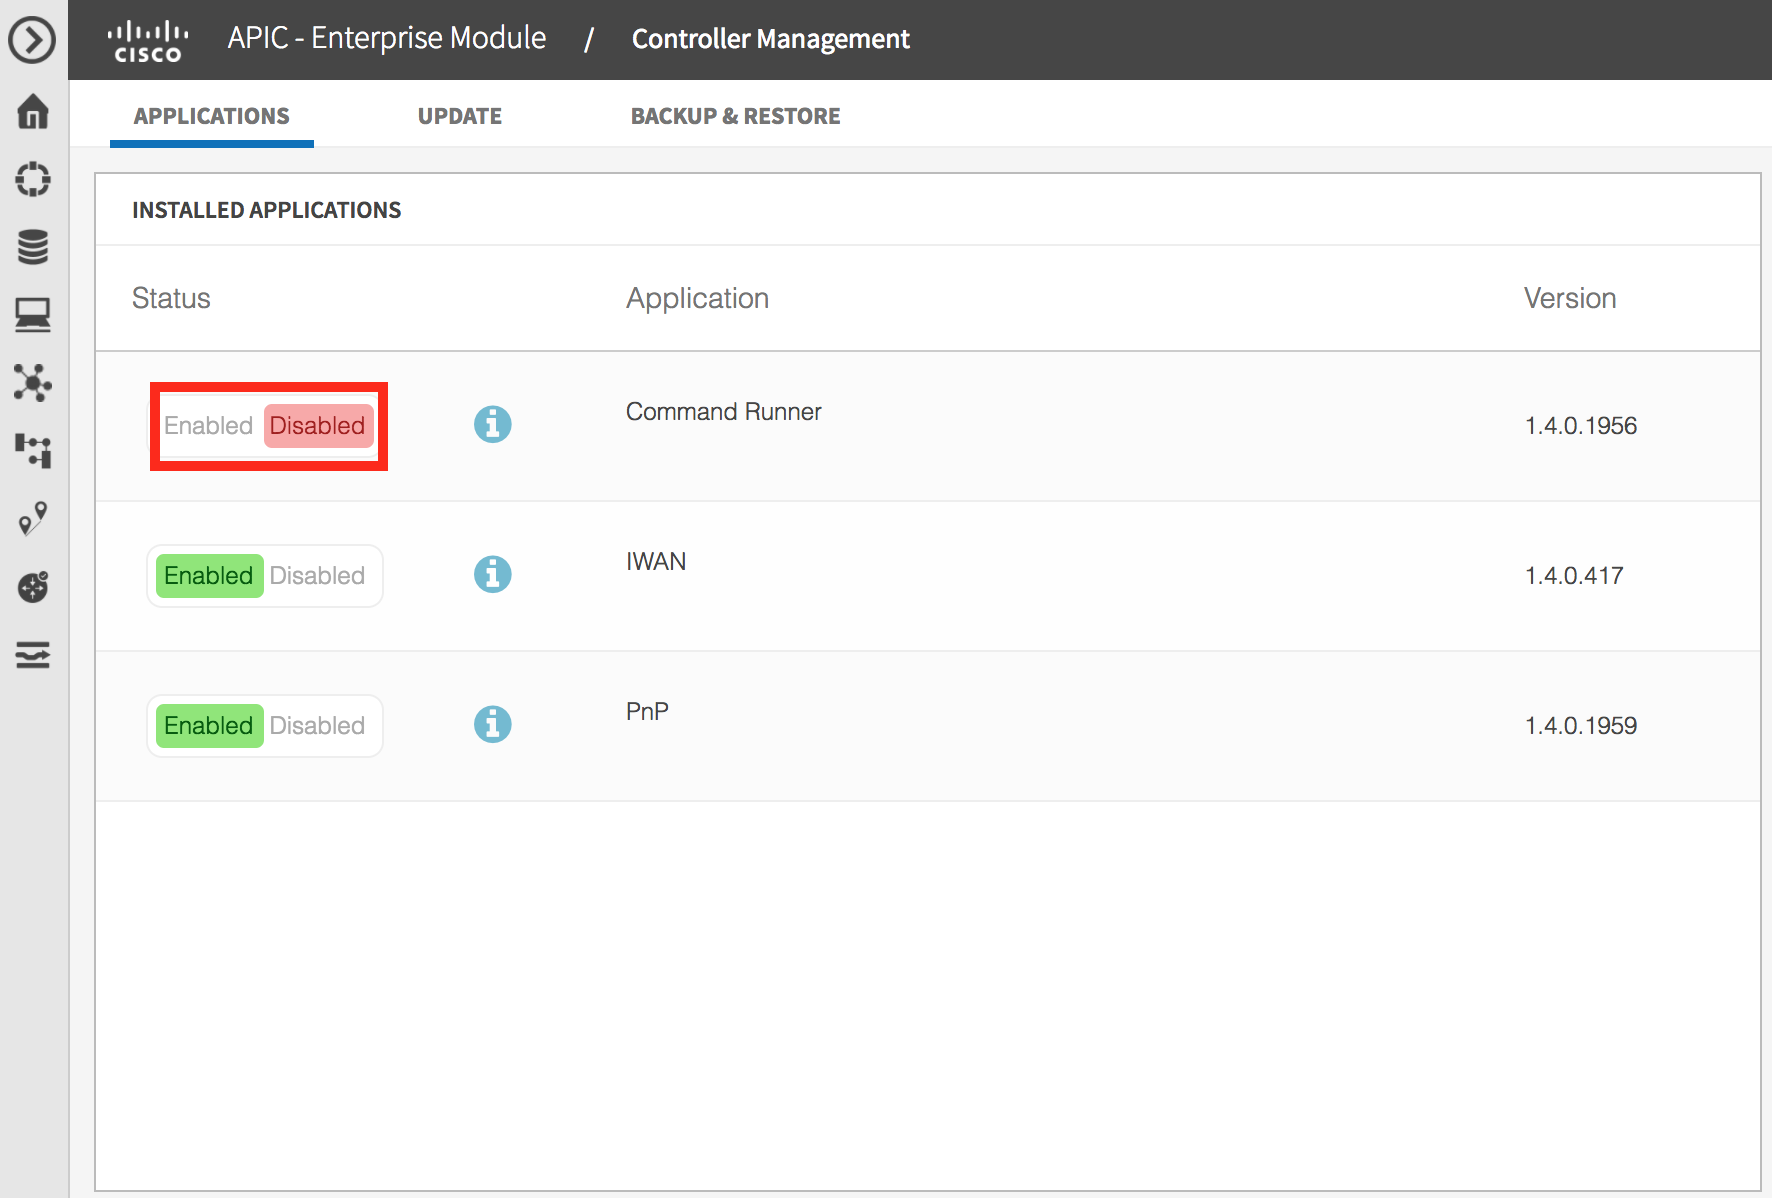
Enabling CommandRunner
CommandRunner is not enabled by default. You have to download and install it from CCO. First login to CCO, and select the CommandRunner application.
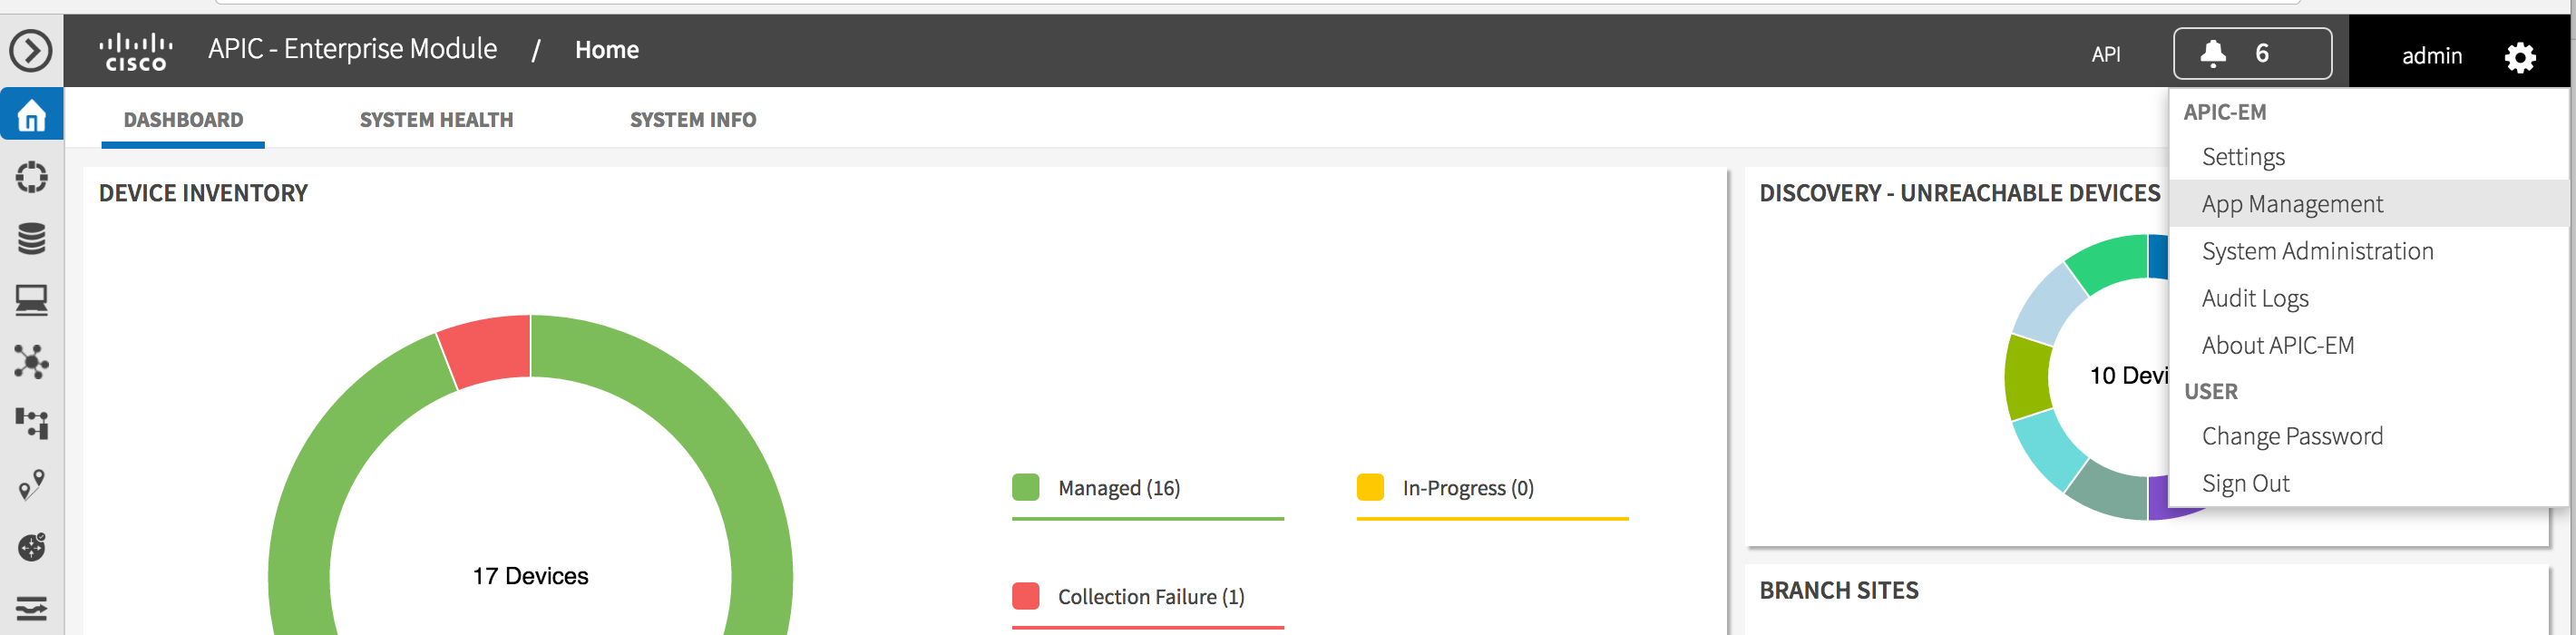
Use the "Admin->App Management" menu to get to the screen to upload onto the controller.
Then drag and drop.
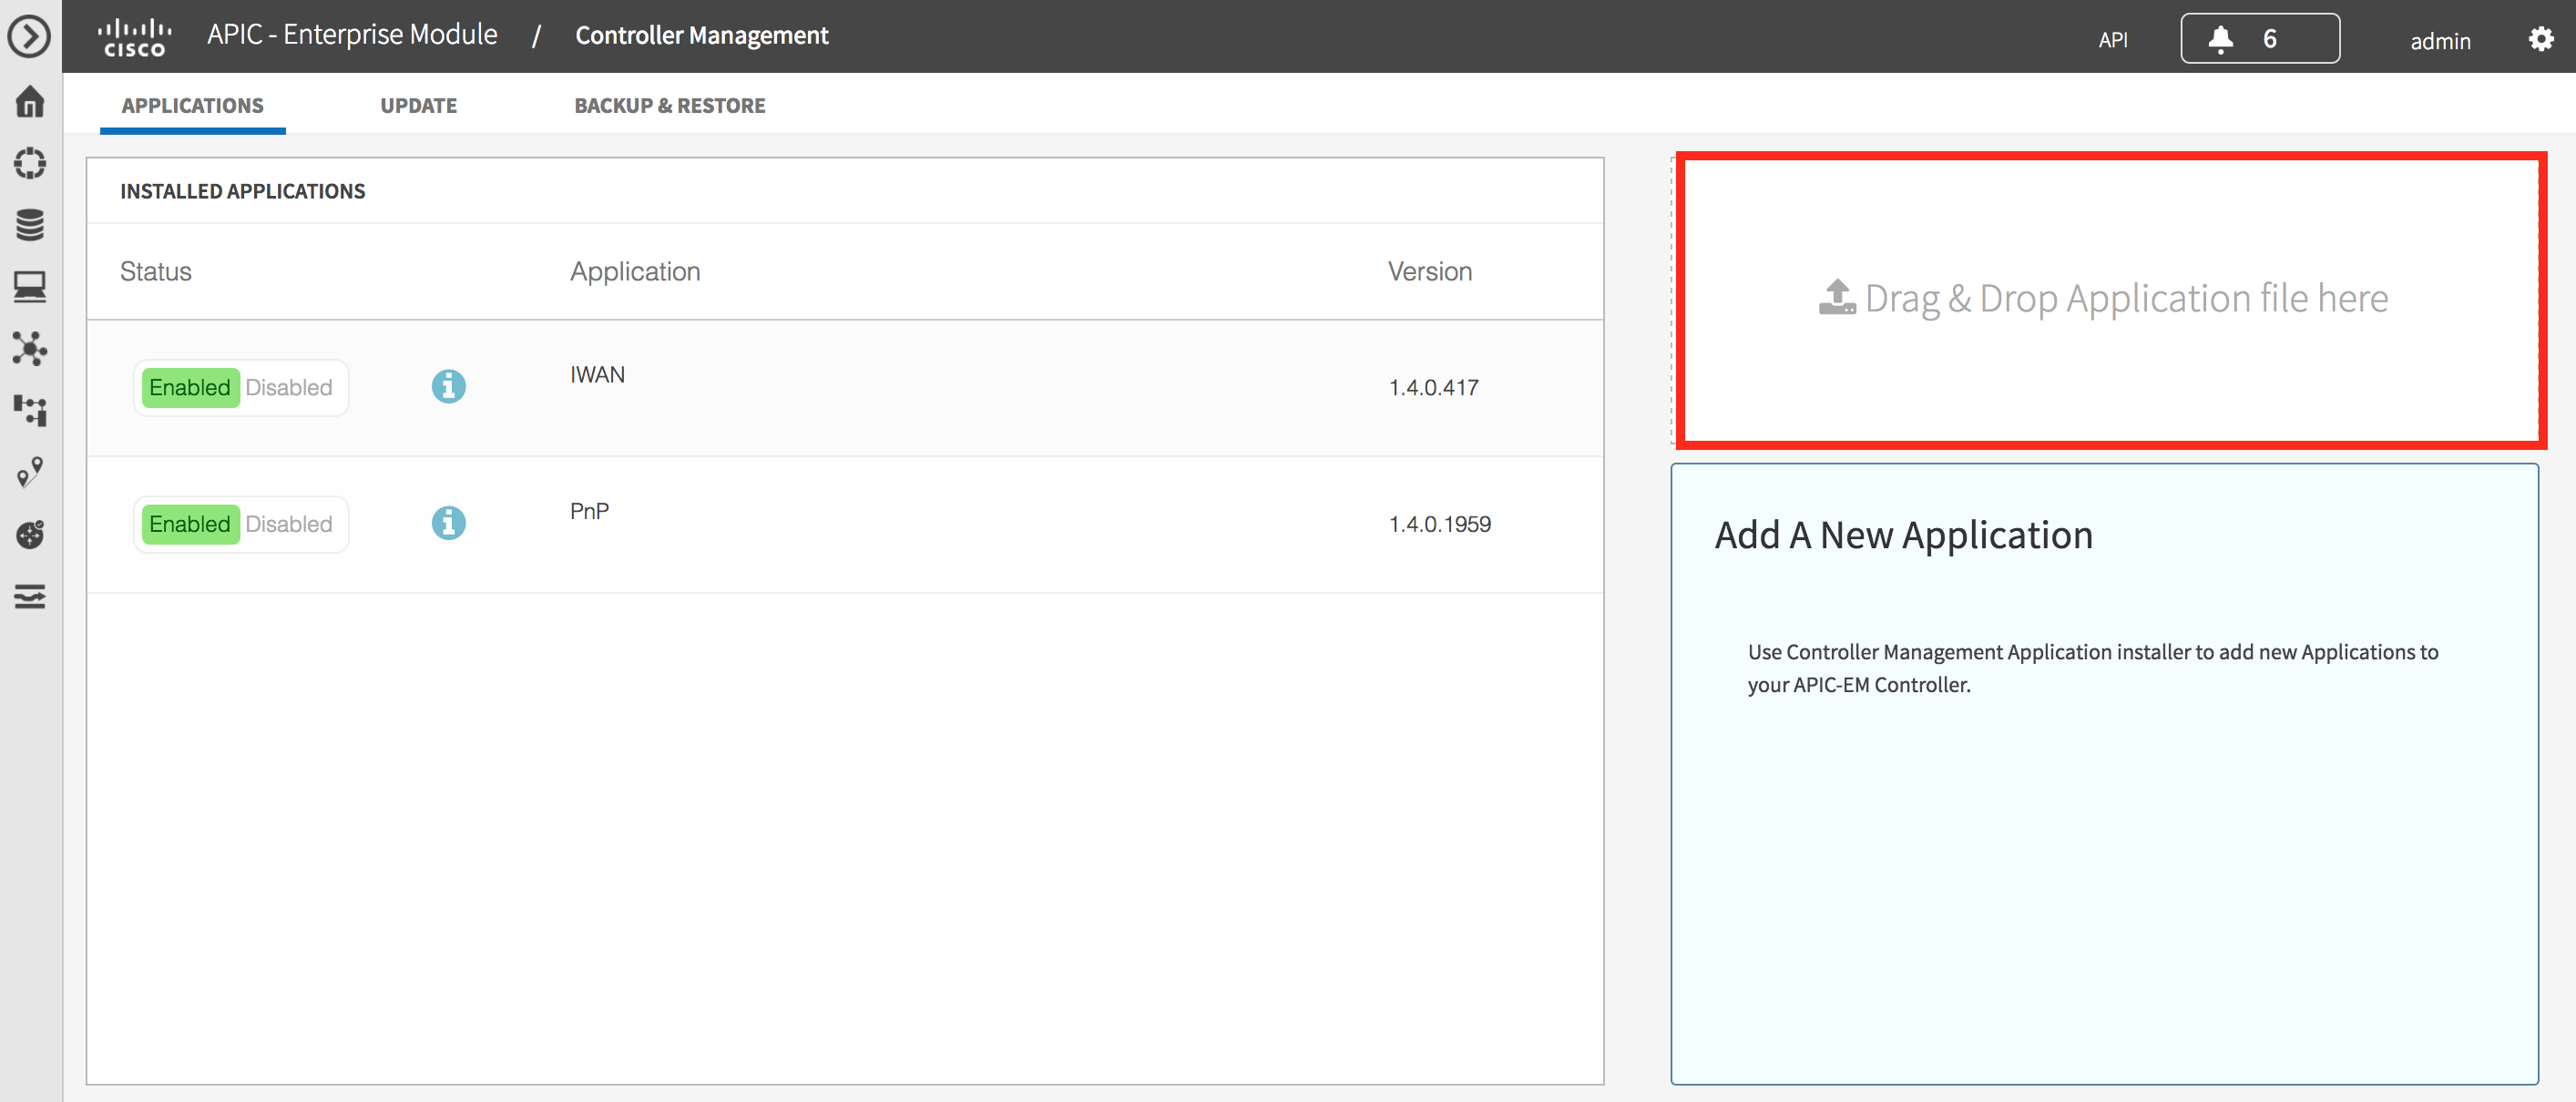
Once the application has been installed (that will take a few minutes) you need to enable it.
What Next?
I will keep adding to these utilities as I get time. They are not officially (or unofficially J) supported, just examples of tools to make life easier.
In the meantime, if you would like to learn more about this, you could come hang out with us in The Cisco Devnet DNA Community. We’ll have a continuous stream of blogs like this and you can ask questions and we’ll get you answers.
In addition, we have a Github repository where you can get examples related to APIC-EM
Thanks for reading,
@adamradford123