Since my discovery of TRex as a tool for performance testing, I've embraced myself the task to test my own lab appliances with it.
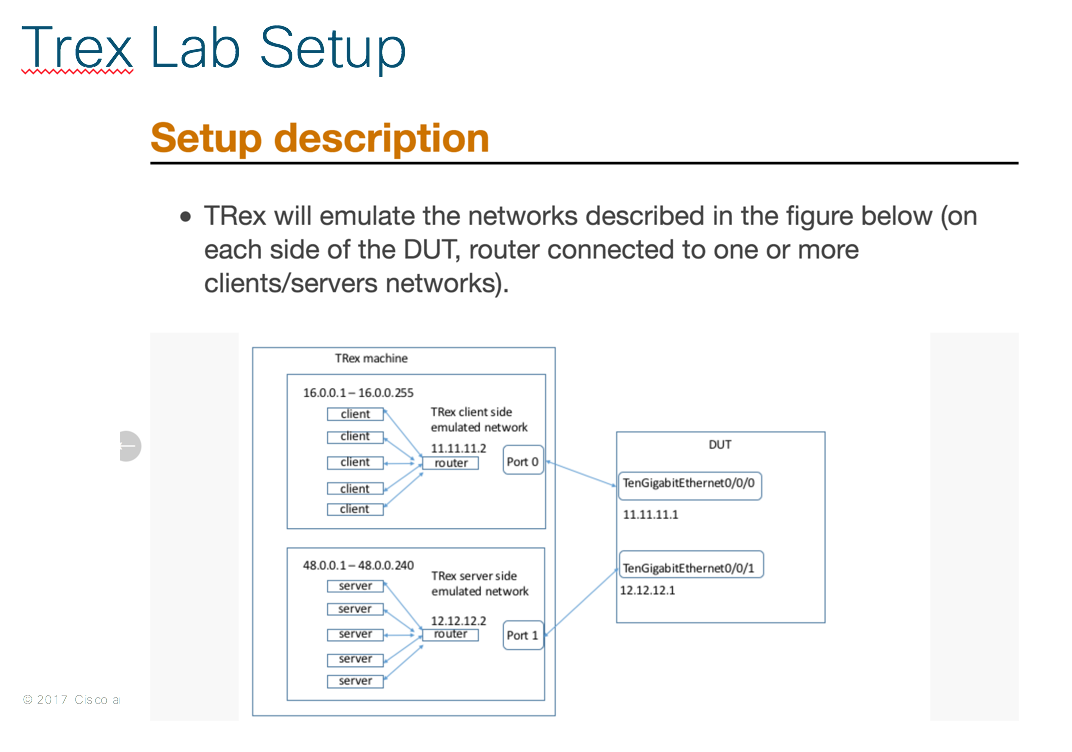
TRex Documentation has this diagram depicting how to test a device using it:
The big challenge is, as today my current setup doesn't use 10Gb interfaces, so neither my UCS Server hosting my TRex VM nor my lab security appliances use high speed interface.
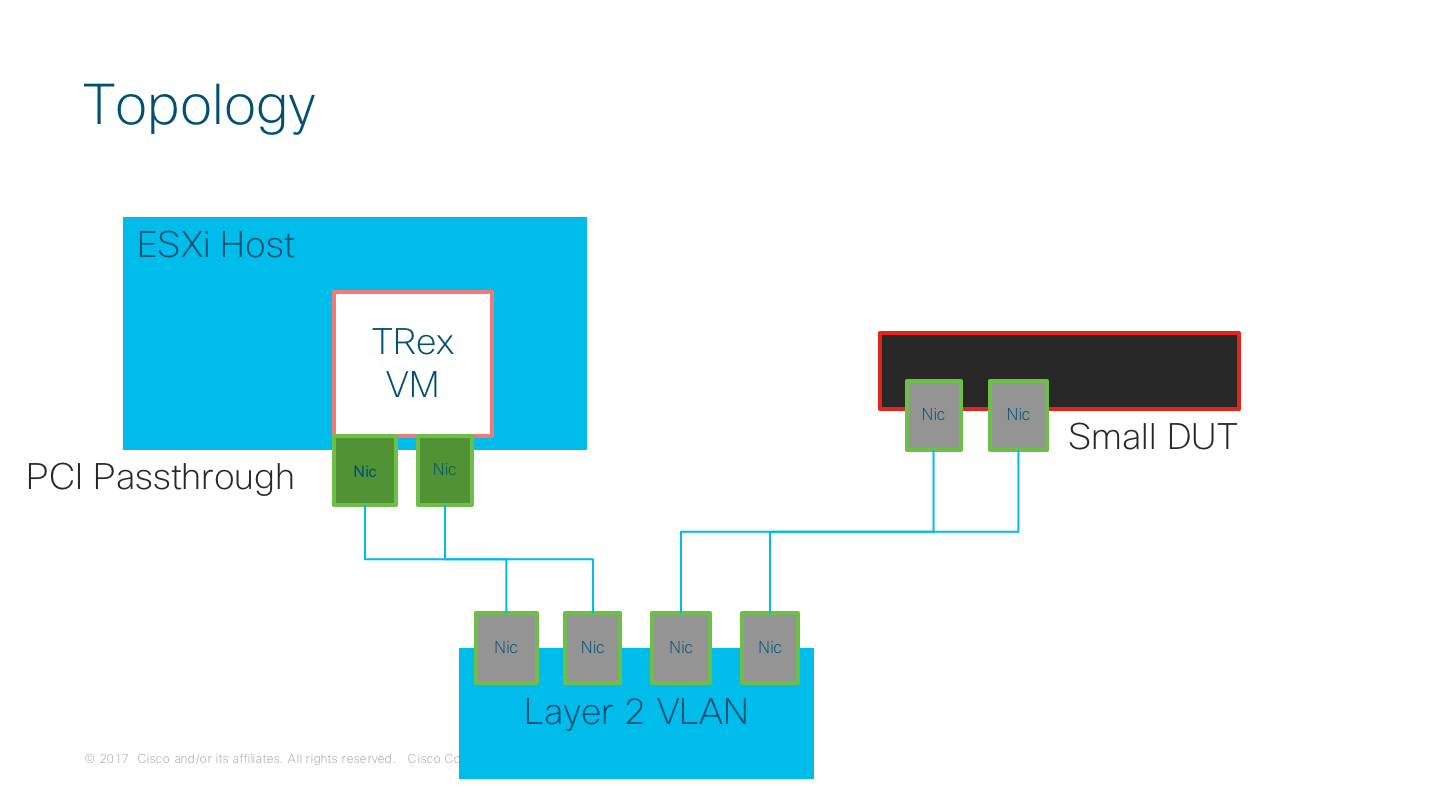
My deployment for TRex is pretty straightforward: a TRex VM running the latest version (v2.32 as the time of this writing), using PCI Passthrough for direct I/O a pair of physical interfaces in the VMware host.
My Current TRex setup looks like this
So here is the config I've use to test FTD appliances, running on ASA hardware (mostly 5508 and 5515). I'm assuming here the reader already has a working deployment of Firepower Management Center and at least a Device is already registered on the FMC.
The process in Firepower Management Center (aka FMC) is as follow
- Create Objects
- Configure FTD Interfaces to match TRex configuration
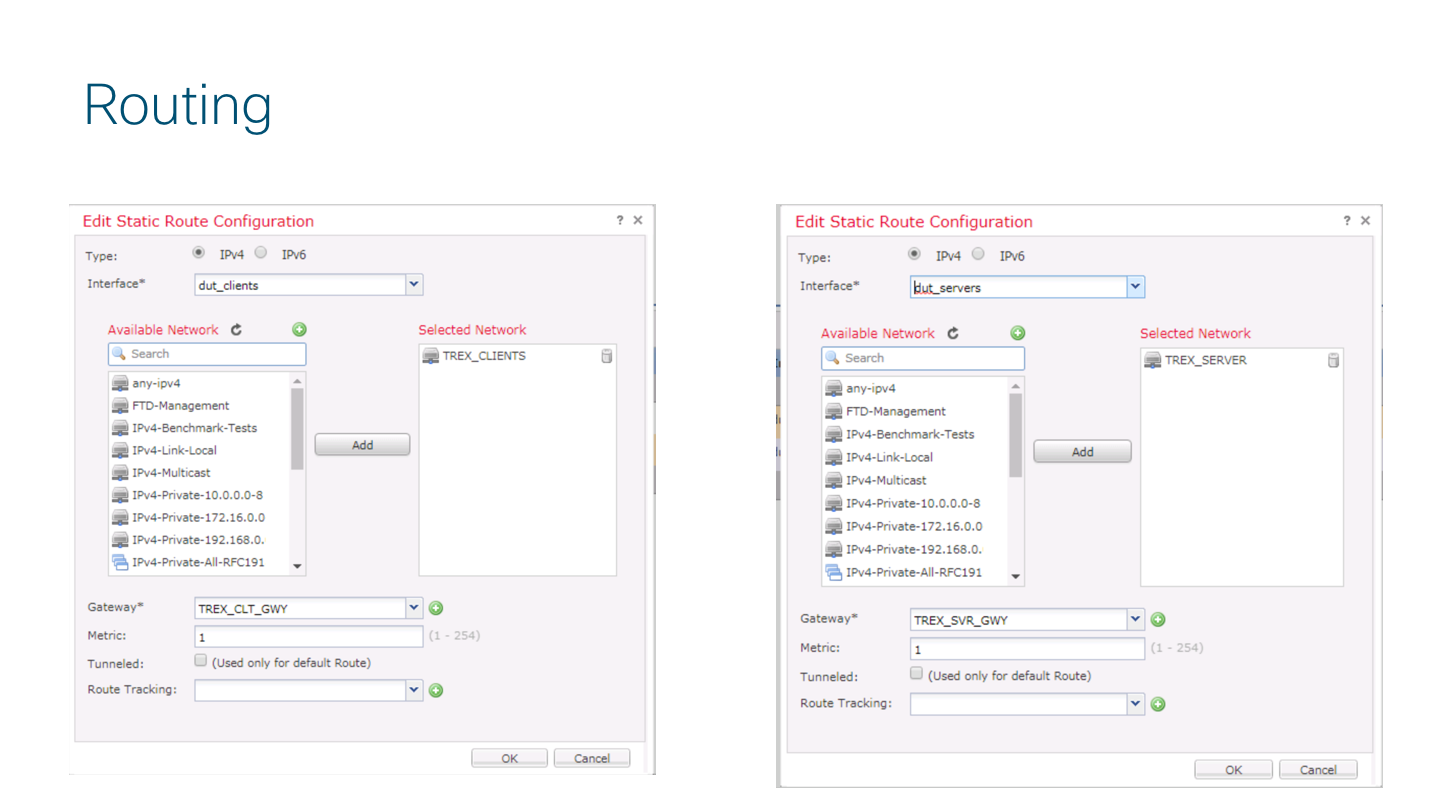
- Configure Static Routing for TRex Clients and Server
- Configure Access Policy to match TRex traffic in both side
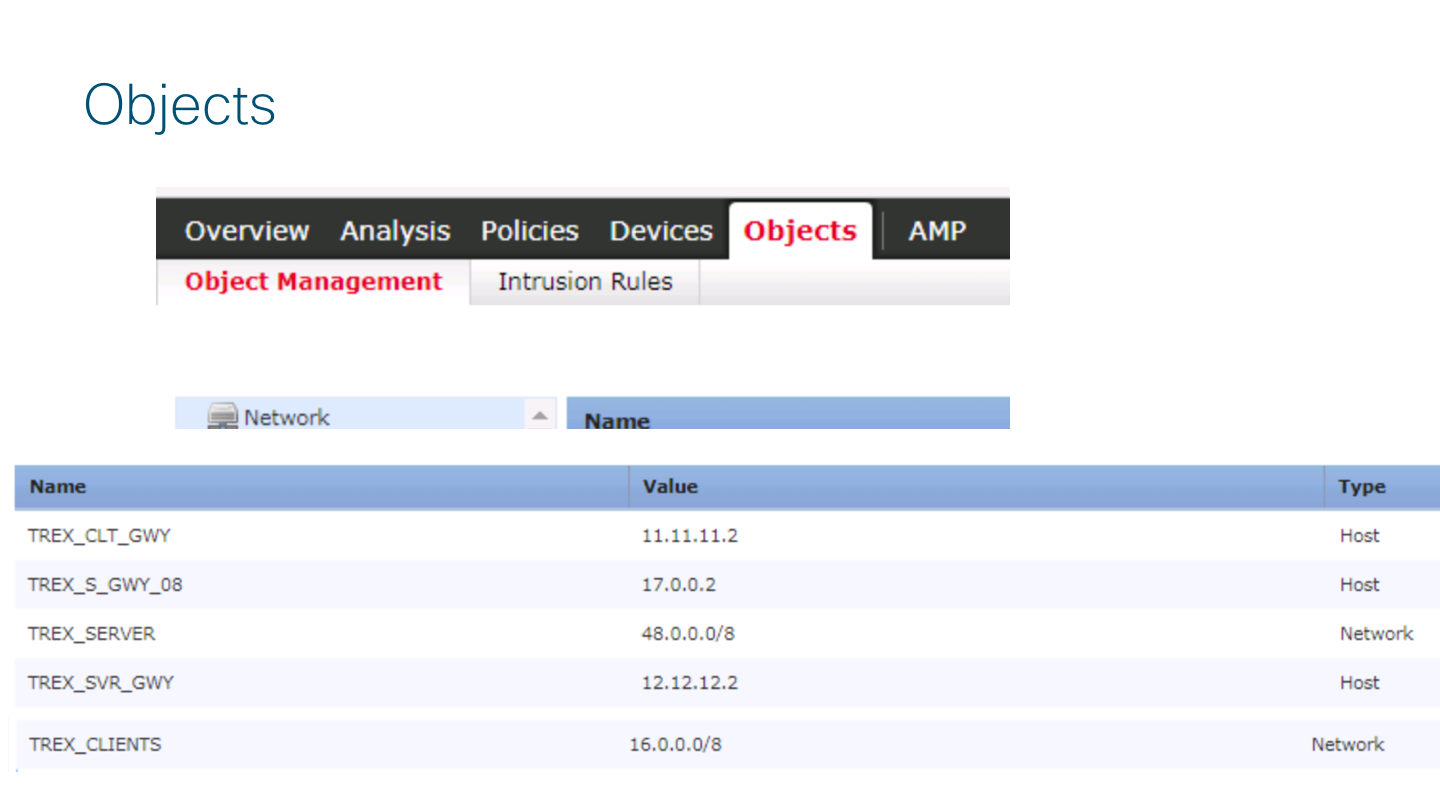
Create Objects
Go to Firepower Management Center (aka FMC) Objects -> Object Management and create objects for the following:
- A Host Object for TRex CLIENTS GATEWAY IP (TREX_CLT_GWY)
- A Host Object for TRex SERVERS GATEWAY IP (TREX_SVR_GWY)
- A network Object for TRex CLIENTS NETWORK (TREX_CLIENTS)
- A network Object for TRex SERVER NETWORK (TREX_SERVER)
See the following image
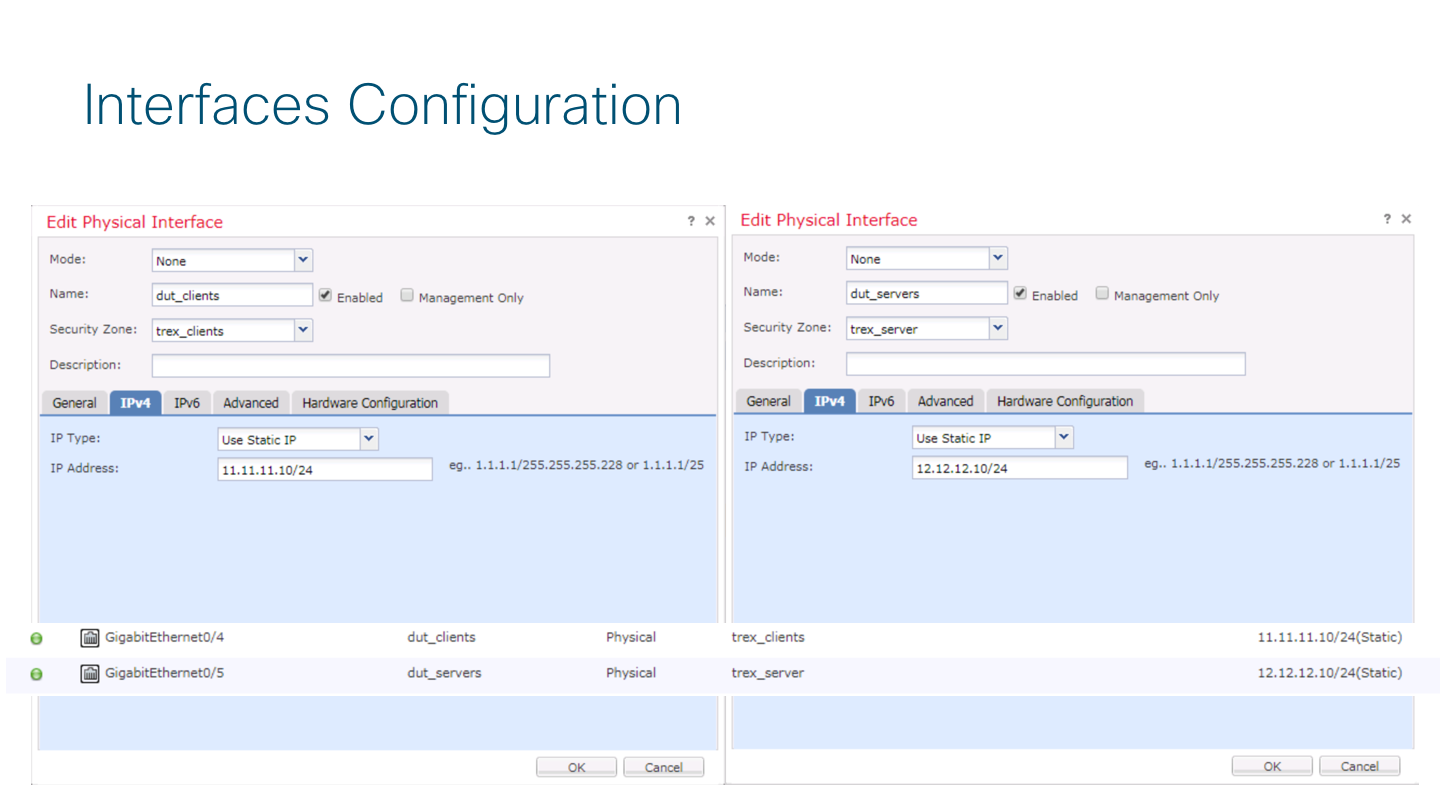
Configure FTD Device Interfaces and Routing
in FMC go to Device Management -> Interfaces and configure the interface for the device accordingly with your configuration on TRex. This will be the next-hop ip TRex will use to send traffic to each side (Client/Server)
Also a static route is required, so go to Routing tab and configure it as follow
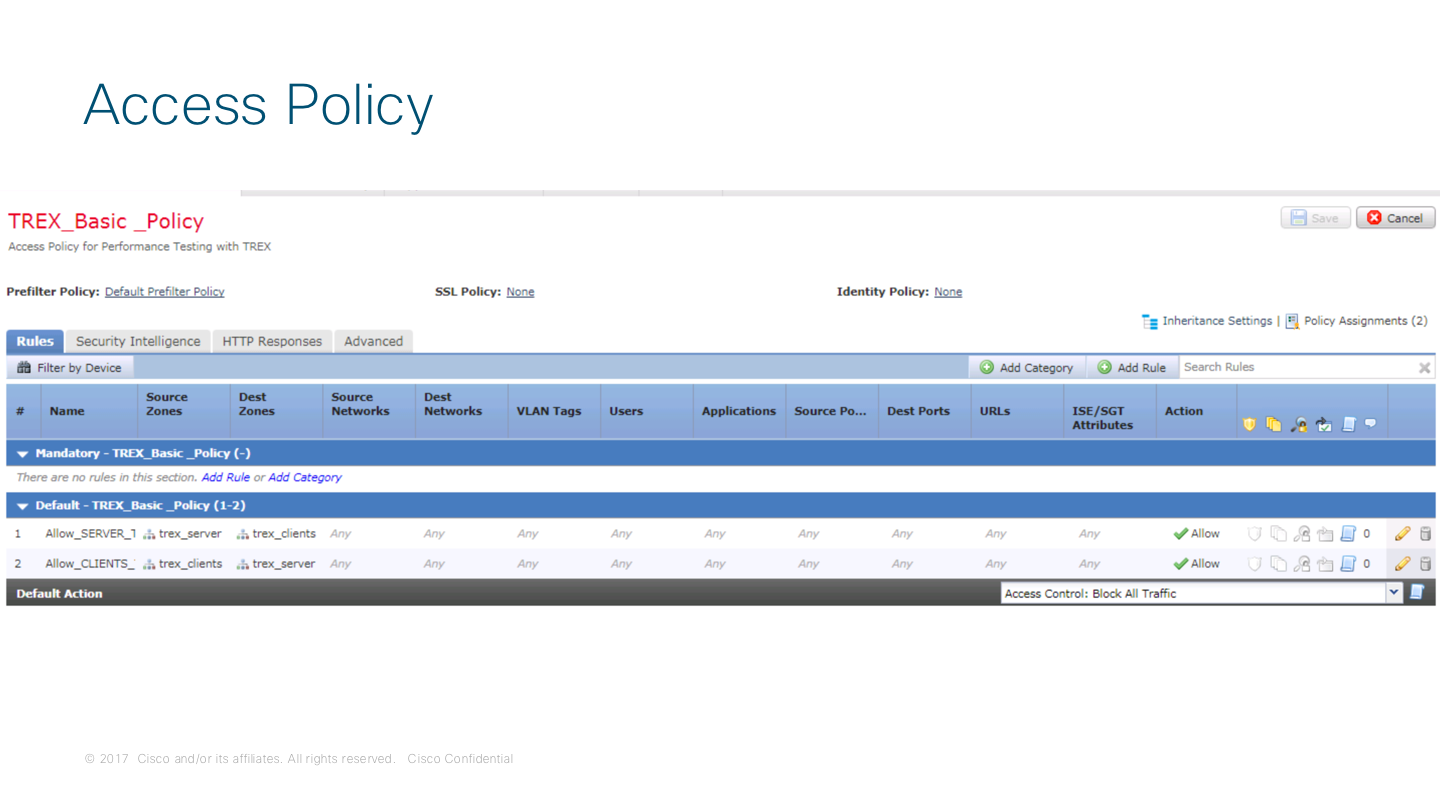
Create the Access Policy for TRex traffic
Due the nature of the test (Performance), a bi directional "any-to-any" rule will be enough to verify traffic passing over the DUT. Your ACP should looks like this:
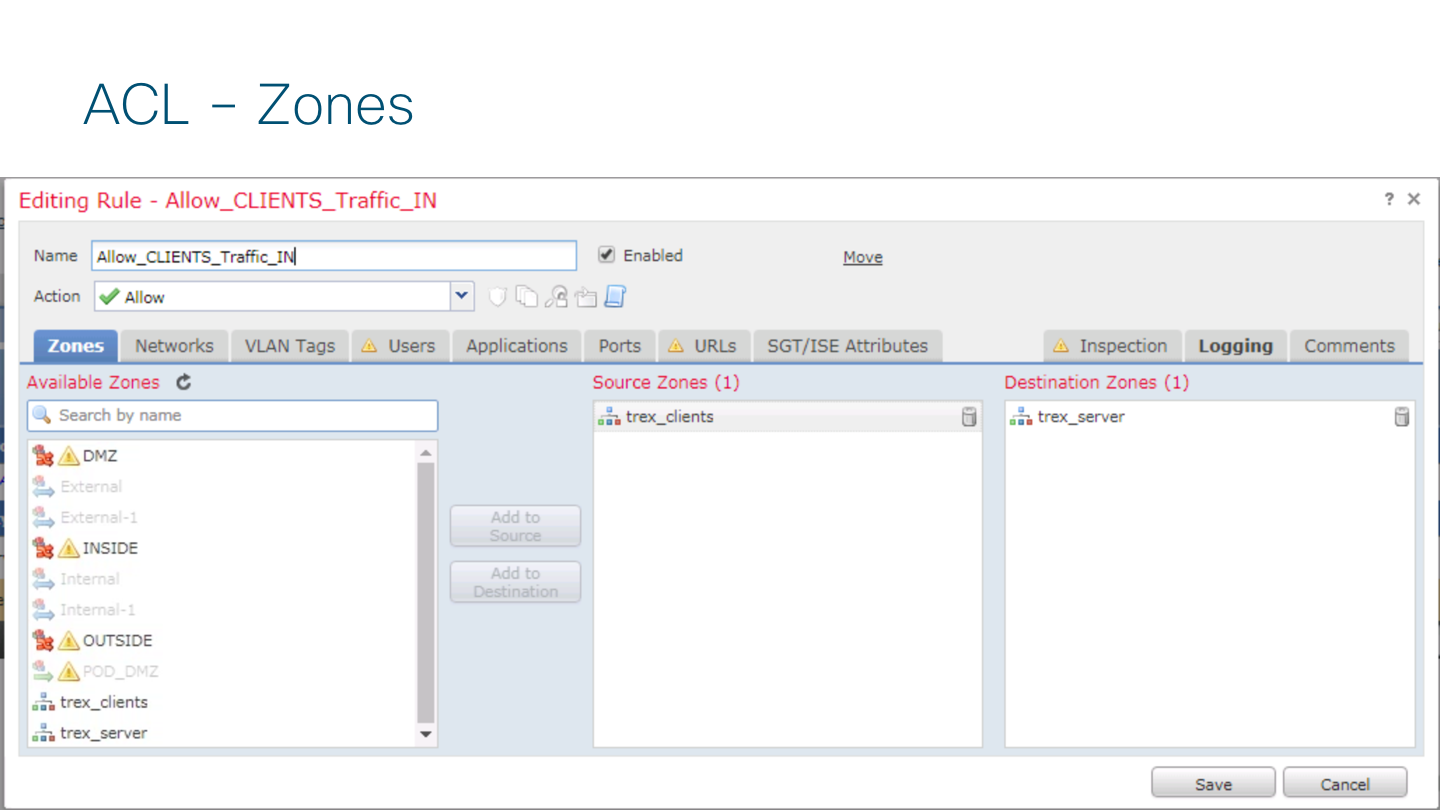
The rule composition looks like this
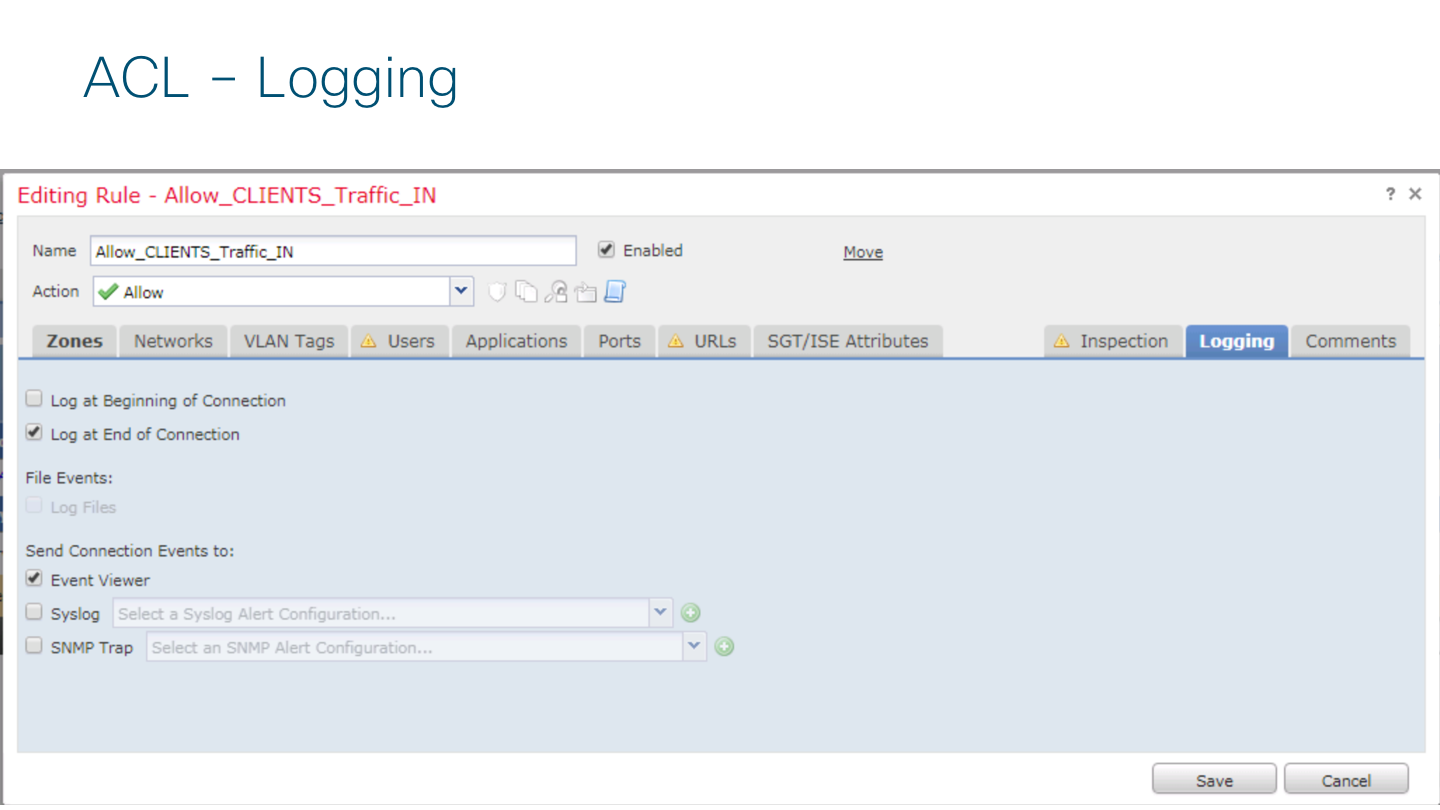
And the logging enable is required to see traffic in FMC
After this remember to DEPLOY THE CHANGES to Device
TRex Side
On the TRex VM I created a YAML file matching the FTD Device interface and routing configuration
# cat /etc/ftd_trex_cfg.yaml
### Config file generated by dpdk_setup_ports.py ###
- port_limit: 2
version: 2
interfaces: ['1b:00.0', '1b:00.1']
port_info:
- ip: 11.11.11.2
default_gw: 11.11.11.10
- ip: 12.12.12.2
default_gw: 12.12.12.10
platform:
master_thread_id: 0
latency_thread_id: 1
dual_if:
- socket: 0
threads: [2,3,4,5,6,7]
Finally, I use this command to test my device with TREX. I'm using the astf option to run all the testing,
# ./t-rex-64 --cfg /etc/ftd_trex_cfg.yaml -f astf/http_simple.py -m 130 -d 120 -c 1 --astf -l 1 -k 10 --l-pkt-mode 2
In this case I'm using the http_simple.py just for verification that everything is working, but additional test with IMIX profile can be run and created by using scapy library.
This test is trying to send 100mbps (-m 130) during 2 minutes (-d 120) and latency test using ICMP (--l-pkt-mode 2, as suggested by Hanoch Haim)
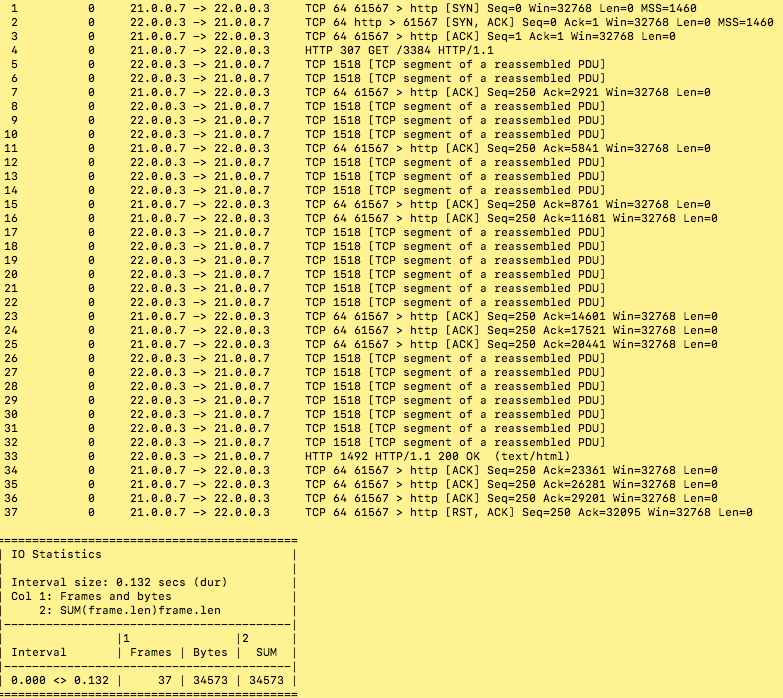
Regarding the http_simple.py, this profile comprise a http conversation of approximately 35Kb in 37 packets. The profile is able to create 2.78 connection per seconds (cps), and for traffic it creates 0.77Mbps or 0.10MBps.
How do you get that info?
Well you can use several tools like tshark. Also TRex has a nice command line that give you all these details.
Why this is important?
Because with this you can calculate the value of the -m parameter to properly send the amount of traffic you are trying to test on the DUT.
Running this command
# ./bp-sim-64-debug -f cap2/http_simple.yaml -o my.erf -v 3
now you can have the profile of the pcap file:

So now it is easy to amplify the traffic by modifying the -m value to the desire amount.
In my case I'd like to generate 100 Mbps, then I need a value of -m 130 which is equivalent of ~100.1 mbps
Once the test start, this is how it looks on the terminal
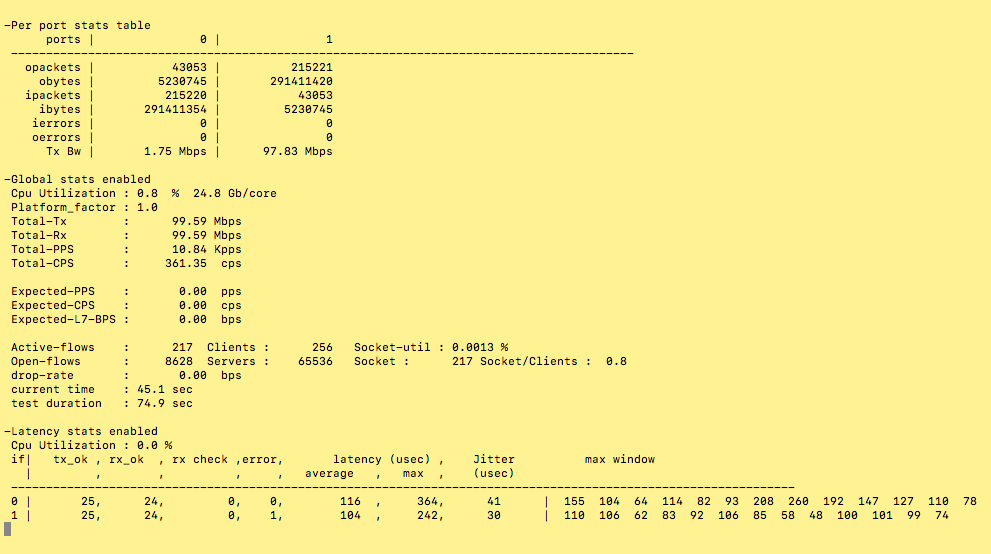
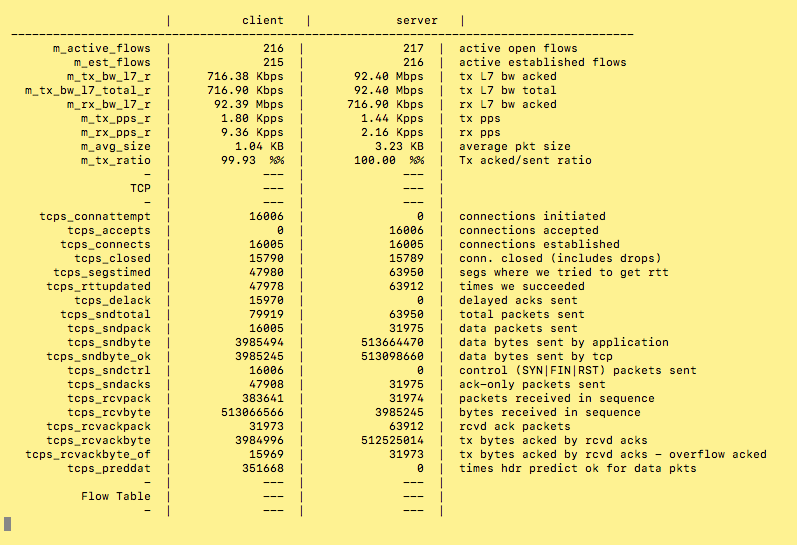
If you press "T" during the test, then you have the counter information in a nice layout (Thanks TRex Team!!)
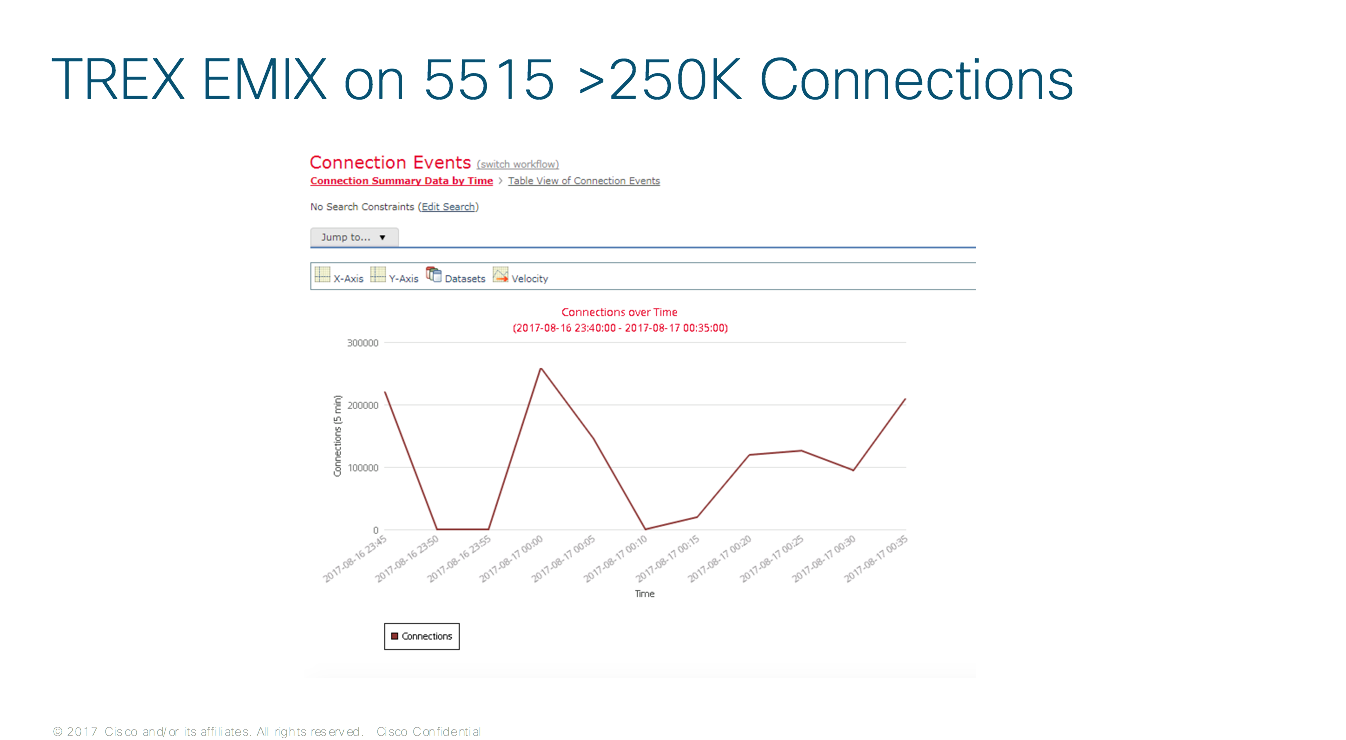
Here is a Graph from FMC registering the test activity
Some useful commands on the FTD/ASA side are
show asp drop
> show asp drop
Frame drop:
Flow is denied by configured rule (acl-drop) 13811230
DNS Inspect id not matched (inspect-dns-id-not-matched) 13810982
Last clearing: 20:27:06 UTC Nov 24 2017 by enable_1
Flow drop:
Last clearing: 20:27:06 UTC Nov 24 2017 by enable_1
>
show traffic
> show traffic
dut_clients:
received (in 53.770 secs):
834594 packets 33383760 bytes
15521 pkts/sec 620862 bytes/sec
transmitted (in 53.770 secs):
0 packets 0 bytes
0 pkts/sec 0 bytes/sec
1 minute input rate 0 pkts/sec, 0 bytes/sec
1 minute output rate 0 pkts/sec, 0 bytes/sec
1 minute drop rate, 0 pkts/sec
5 minute input rate 0 pkts/sec, 0 bytes/sec
5 minute output rate 0 pkts/sec, 0 bytes/sec
5 minute drop rate, 0 pkts/sec
dut_servers:
received (in 53.770 secs):
834993 packets 33399720 bytes
15528 pkts/sec 621159 bytes/sec
transmitted (in 53.770 secs):
0 packets 0 bytes
0 pkts/sec 0 bytes/sec
1 minute input rate 0 pkts/sec, 0 bytes/sec
1 minute output rate 0 pkts/sec, 0 bytes/sec
1 minute drop rate, 0 pkts/sec
5 minute input rate 0 pkts/sec, 0 bytes/sec
5 minute output rate 0 pkts/sec, 0 bytes/sec
5 minute drop rate, 0 pkts/sec
Another useful command
tshark to evaluate the pcap file
# tshark -r avl/delay_10_http_browsing_0.pcap -z io,stat,0,"SUM(frame.len)frame.len"
Final thoughts
Maybe TRex has been created with high perf testing use cases in mind, but it is also useful on this kind of scenarios where small appliances need to be put under test quick and easy.
In my current setup I've also modified my config to test small ISR Routers, just to see how flexible is this TRex.
Thanks for this awesome and useful tool.
Freddy Bello M
frbello@cisco.com
Puerto Rico
CSE GSSO