- Cisco Community
- Technology and Support
- Networking
- Networking Knowledge Base
- Using ThousandEyes Internet Insights to Monitor Office 365 Outages
- Subscribe to RSS Feed
- Mark as New
- Mark as Read
- Bookmark
- Subscribe
- Printer Friendly Page
- Report Inappropriate Content
- Subscribe to RSS Feed
- Mark as New
- Mark as Read
- Bookmark
- Subscribe
- Printer Friendly Page
- Report Inappropriate Content
on
08-26-2024
05:09 PM
- edited on
08-27-2024
02:15 PM
by
Tyler Langston
![]()
Welcome to another article in our series about ThousandEyes! Today we'll explore one of the key modules available to you as a ThousandEyes customer, Internet Insights, and how it can help you quickly identify outages and their root causes with an example of an Office 365 outage.
What is ThousandEyes?
ThousandEyes is a powerful SaaS platform that gives a digital picture of enterprise infrastructure, formed by test views, alerts, dashboards, and other components. The ThousandEyes Internet Insights module provides macro-level visibility into outages that could impact you by leveraging the collective intelligence of ThousandEyes' extensive agent network. In this article, we'll explore an example of how to utilize Internet Insights to monitor Office 365 outages.
What is ThousandEyes Internet Insights?
Officially, "The Internet Insights module gives you macro-level visibility into outages that may affect you, using the collective intelligence of ThousandEyes’ entire agent network. Internet Insights presents a global map view of network outages and application outages, and a cross-layer visualization of those outages."
By leveraging the collective intelligence from every test conducted on the ThousandEyes platform, Internet Insights allows you to get that big picture view of performance and lets you ensure uninterrupted access to critical business applications, maintain seamless operations and improve user experience.
How can Internet Insights help?
Let's show you! As mentioned earlier, this article will focus on analyzing real data related to an Office 365 outage, to show you a practical example demonstrating the effectiveness of Internet Insights in both detecting and managing an outage.
Internet Insights Case Study
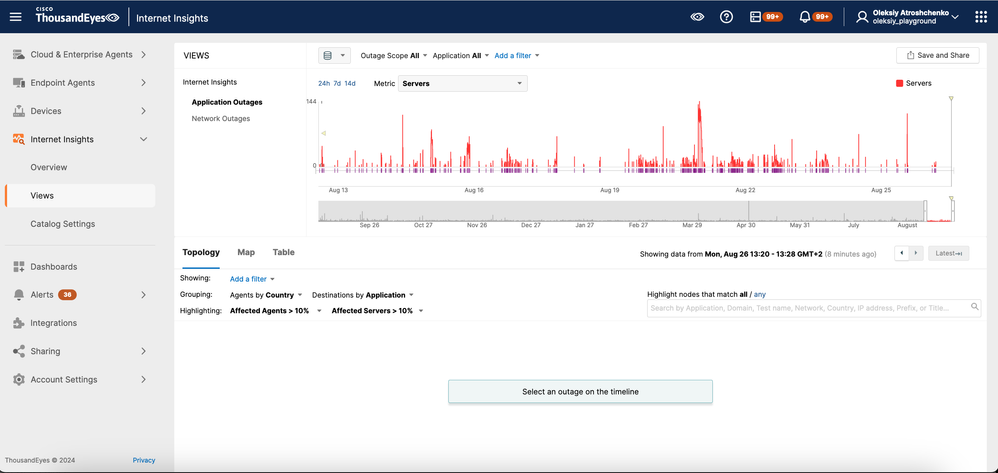
We'll begin by examining the unfiltered data from the past 14 days in the Internet Insights > Views page. Notice the 'Application Outages' section has a number of spikes. It's important to note, however, that this is for all tests being run by ThousandEyes agents, and we need to refine this further to get relevant data for us:
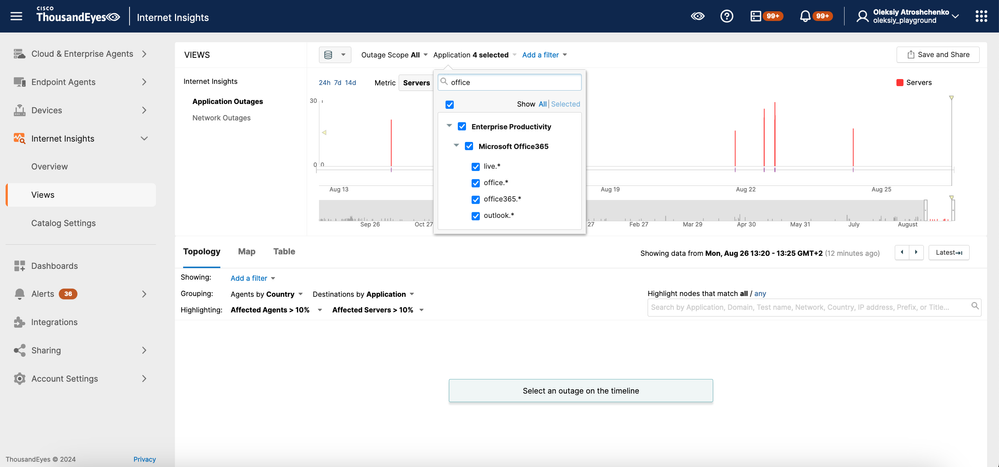
To do that, we can click 'Application: All' at the top of the Views page and search by keyword for the filters we're looking for. I used the term 'office' to bring up the list of available options. This will let us fine tune the entire scope of outages:
Check the boxes of the applicable filters for your search (I used all of Microsoft Office365). Now, let’s get the filter applied:
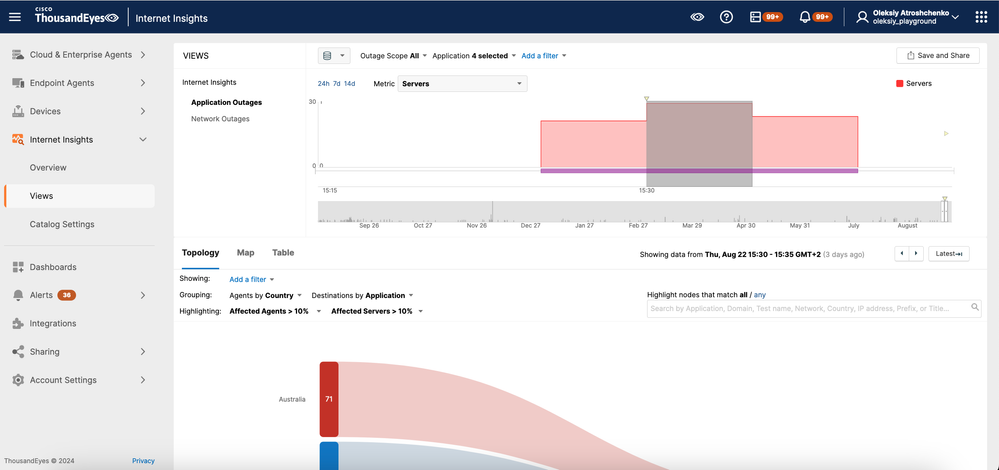
Once applied, here’s how the view looks for the past 14 days. Notice that this gives us specific dates and times to dive into:
Let’s move to a specific date and time to continue reviewing the details. We’re drilled down into the data from Thursday, August 22, 15:30 - 15:35 GMT+2, and looking at the 'Topology' option of the submenu:
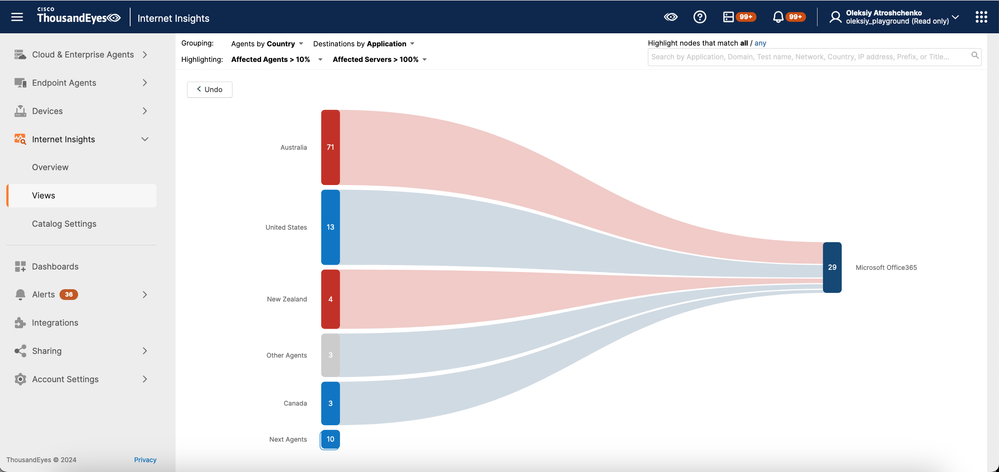
Scrolling down the page a bit lets us view the graph displaying the data grouped by country and application. This is where things can get really interesting:
Before we move on further, let's break down what each area means in simple terms.
Each country grouping is clickable! Hovering the mouse over 'United States (13)' reveals the details of the error type affecting 13 agents in the US:
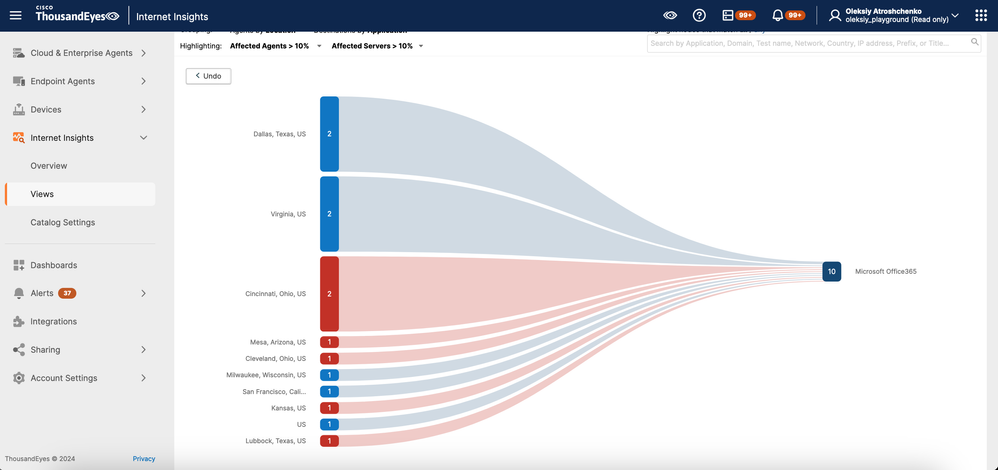
Clicking on the '13,' will open a view grouped by U.S. states:
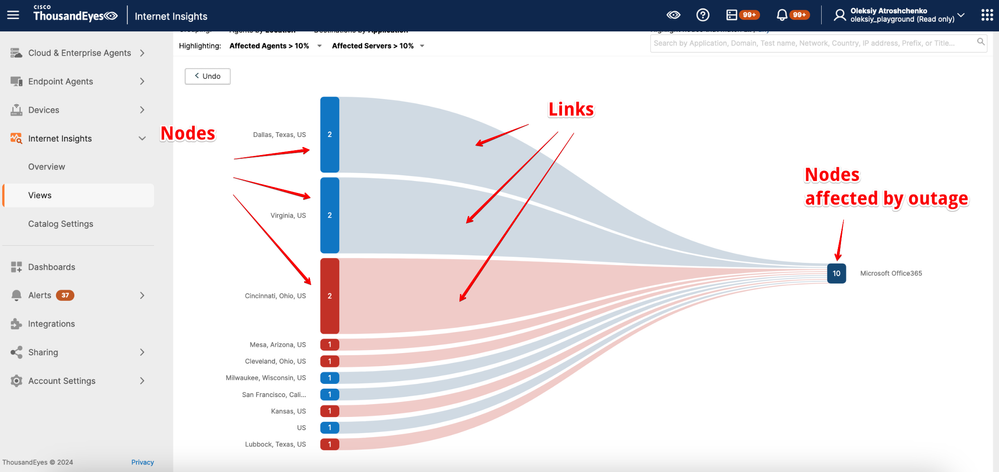
Let’s take a closer look at this particular page and set terminology for what you're seeing, Nodes, Links, and Nodes affected by outage:
Nodes represent the number of agents affected by a specific type of outage error. For instance, if we hover over Dallas, TX, we’ll see that 2 agents in Dallas, TX, are experiencing DNS issues (DNS timeout) while trying to connect to Microsoft Office 365:
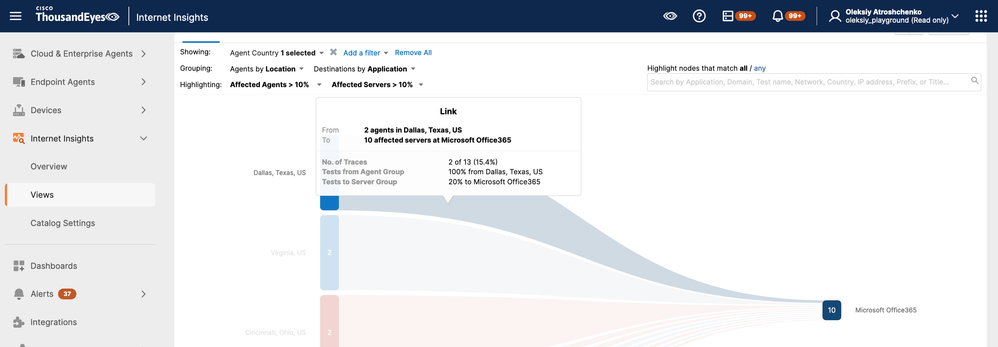
Links represent the number of affected traces, the percentage of tests from the agent group, and the percentage of tests from the server group.
In this example, we observe that 15.4% of traces (2 out of 13) are affected, with 100% of tests from the Agent Group and 20% of tests directed to the Server Group Office 365:
Nodes affected by the outage indicates the number of affected servers at Microsoft Office 365 (10), an Application Outage (1), and the percentage of affected tests (1%):
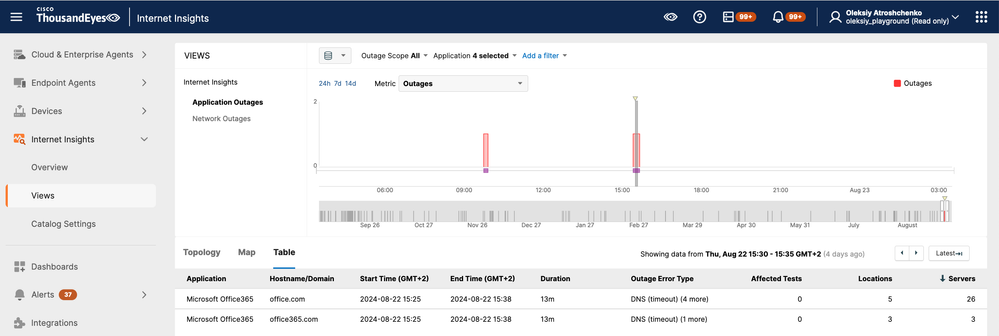
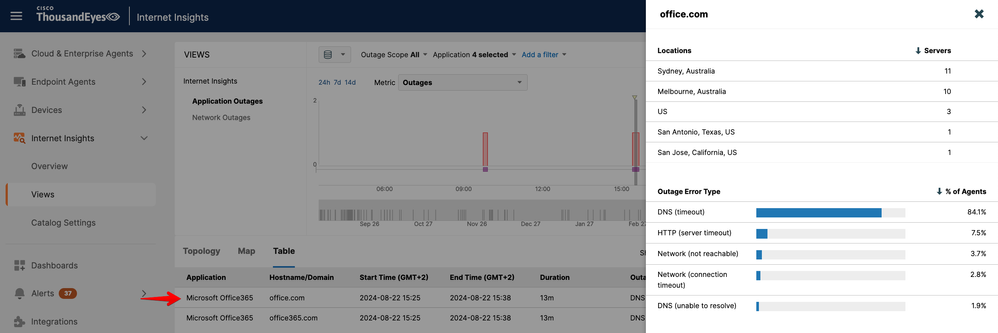
Details about outage domains, timings, locations, and the number of affected servers can be found under the 'Table' submenu of the Internet Insights > Views page (just scroll back up and move from 'Topology' to 'Table'):
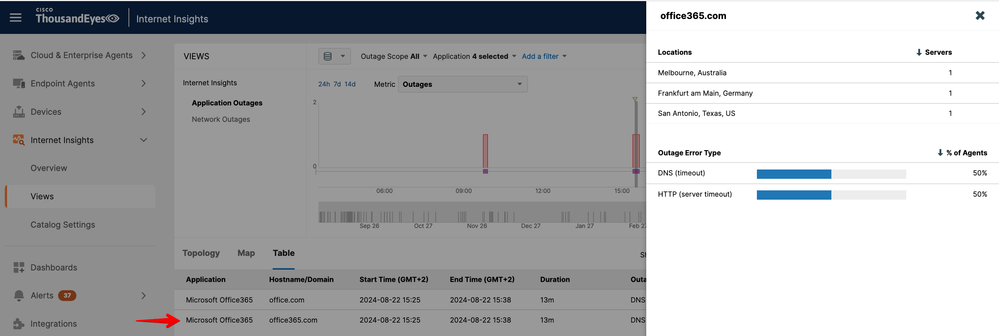
In our case, we see that the outage began on 2024-08-22 at 15:25 GMT+2 and lasted for 13 minutes. Additionally, you can view data grouped by each domain, such as office.com and office365.com, by clicking on each respective line.
For our purposes, we can see that the outage related to the office.com domain involved 5 error groups with their respective percentages, and affected 26 servers along with their locations, while the office365.com domain had fewer, letting us know where to investigate further if additional information is required:
In conclusion, leveraging ThousandEyes Internet Insights to monitor Office 365 outages provides invaluable visibility into service disruptions, allowing for proactive management and ensuring a more reliable user experience.
If you run into any issues renewing a self-signing certificate and are an existing customer (or use a trial license of ThousandEyes) - you can always contact our expert engineers and get almost instant support using ThousandEyes chat.
Other useful ThousandEyes & knowledge resources:
- Main web page: thousandeyes.com
- ThousandEyes Internet Insights documentation
- ThousandEyes Application page
Find answers to your questions by entering keywords or phrases in the Search bar above. New here? Use these resources to familiarize yourself with the community:


