- Cisco Community
- Technology and Support
- Networking
- SD-WAN and Cloud Networking
- Re: Monitoring path changes for traffic classes in SD WAN
- Subscribe to RSS Feed
- Mark Topic as New
- Mark Topic as Read
- Float this Topic for Current User
- Bookmark
- Subscribe
- Mute
- Printer Friendly Page
- Mark as New
- Bookmark
- Subscribe
- Mute
- Subscribe to RSS Feed
- Permalink
- Report Inappropriate Content
01-24-2023 07:55 AM
We've been looking for a way to sort of replicate the output of our IWAN monitoring of traffic classes to check which transport is currently being used and when previous switchovers between transports occurred and why. For example, in IWAN if you want to check a class flipping between transports:
NJ-RTR#sh domain iwan-prod master traffic-classes dscp af31
Dst-Site-Prefix: 10.110.125.64/26 DSCP: af31 [26] Traffic class id:2664230
Clock Time: 10:45:42 (EST) 01/24/2023
TC Learned: 1w2d ago
Present State: CONTROLLED
Current Performance Status: in-policy
Current Service Provider: MPLS since 6d01h
Previous Service Provider: INET pfr-label: 1:2 | 0:0 [0x1020000] for 181 sec
BW Used: 91 bps
Present WAN interface: Tunnel61 in Border 10.150.110.88
Present Channel (primary): 157029 MPLS pfr-label:1:1 | 0:0 [0x1010000]
Backup Channel: none
Destination Site ID bitmap: 2
Destination Site ID: 10.19.94.1 (Active)
Class-Sequence in use: 30
Class Name: critical-data using policy User-defined
priority 2 packet-loss-rate threshold 5.0 percent
priority 1 one-way-delay threshold 150 msec
priority 2 byte-loss-rate threshold 5.0 percent
BW Updated: 00:00:11 ago
Reason for Latest Route Change: Move to higher preferred link, same active/standby status NH
Route Change History:
Date and Time Previous Exit Current Exit Reason
1: 09:06:05 (EST) 01/18/23 INET(1:2|0:0)/10.150.110.88/Tu60 (Ch:157030) MPLS(1:1|0:0)/10.150.110.88/Tu61 (Ch:157029) Move to higher preferred link, same active/standby status NH
2: 09:03:04 (EST) 01/18/23 MPLS(1:1|0:0)/10.150.110.88/Tu61 (Ch:157029) INET(1:2|0:0)/10.150.110.88/Tu60 (Ch:157030) Out-of-Policy (One Way Delay : 153 msec)
3: 17:20:40 (EST) 01/14/23 None(0:0|0:0)/0.0.0.0/None (Ch:0) MPLS(1:1|0:0)/10.150.110.88/Tu61 (Ch:157029) Uncontrolled to Controlled Transition
-----------------------------------------------------------------------------------------------------------------------------------------------------------------------------
Total Traffic Classes: 1 Site: 1 Internet: 0
Is there anything comparable in SD WAN? We've tried everything under the Monitor tab in vManage, and some commands but everything has come up short. I'm wondering if anyone else has the same experience.
thanks,
Bill
Solved! Go to Solution.
- Labels:
-
SD-WAN App Experience
Accepted Solutions
- Mark as New
- Bookmark
- Subscribe
- Mute
- Subscribe to RSS Feed
- Permalink
- Report Inappropriate Content
01-24-2023 02:28 PM
I am not aware of an all in one command on the CLI, or webpage in vmanage that will produce the single pane of glass of all this info. The vManage APIs are the best way to get this information from my experience all into a single pane.
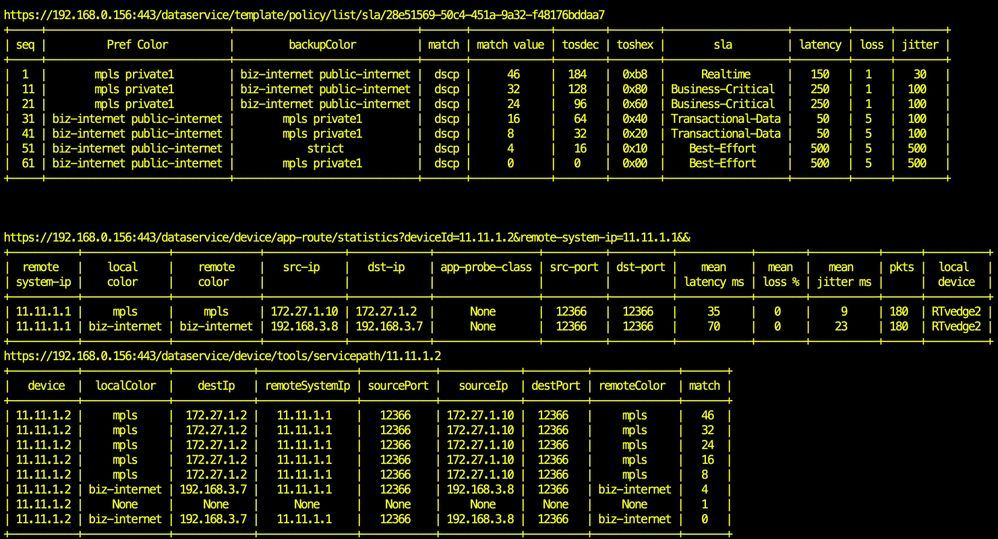
The first table below is a concatenation of the SLA classes and APP route policy.
The second table is the current app-aware stats measuring the realtime loss,latency and jitter between the endpoints.
The third table is the simulate flows from vmanage and produces what classification (DSCP in my network) is riding which transport. DSCP 8,16 are on the MPLS path or backup path because the realtime latency is 70ms on biz-internet has exceeded the SLA (50ms). All other traffic is riding the preferred transport.
- Mark as New
- Bookmark
- Subscribe
- Mute
- Subscribe to RSS Feed
- Permalink
- Report Inappropriate Content
01-24-2023 11:14 AM
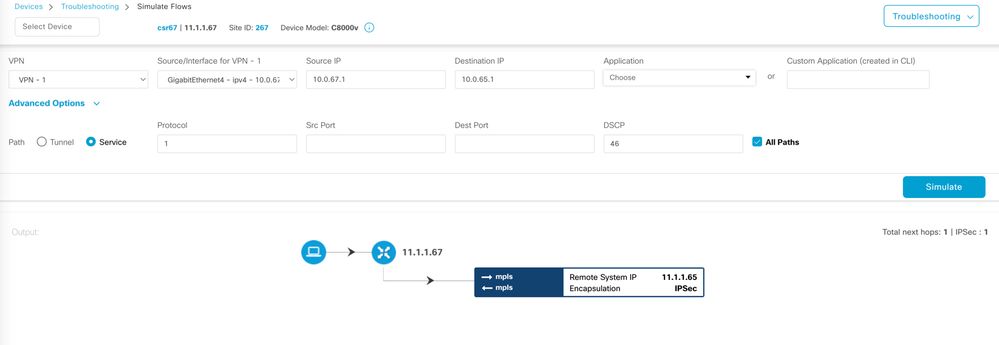
Under Monitor, device, troubleshooting, simulate you can simulate traffic and it will report the transport the traffic egress. This is 20.9 version and may be under Monitor, Network, troubleshooting, simulate in previous releases.
- Mark as New
- Bookmark
- Subscribe
- Mute
- Subscribe to RSS Feed
- Permalink
- Report Inappropriate Content
01-24-2023 01:02 PM
Thanks Dan. Yeah, that gets us part of the way. We know what the current path is, but I was hoping to find something that would also tell us the last switching paths and the reason for the switch, similar to how IWAN provided that info. For example, if in your example above DSCP 46 is set to prefer MPLS but you run this test and it shows the flow is using public-internet, you can't immediately tell which of the policies has been violated to cause the switch, and when that switch occurred. I guess you have to fish through events and cobble it together. I was hoping there was a command that might combine them.
- Mark as New
- Bookmark
- Subscribe
- Mute
- Subscribe to RSS Feed
- Permalink
- Report Inappropriate Content
01-24-2023 02:28 PM
I am not aware of an all in one command on the CLI, or webpage in vmanage that will produce the single pane of glass of all this info. The vManage APIs are the best way to get this information from my experience all into a single pane.
The first table below is a concatenation of the SLA classes and APP route policy.
The second table is the current app-aware stats measuring the realtime loss,latency and jitter between the endpoints.
The third table is the simulate flows from vmanage and produces what classification (DSCP in my network) is riding which transport. DSCP 8,16 are on the MPLS path or backup path because the realtime latency is 70ms on biz-internet has exceeded the SLA (50ms). All other traffic is riding the preferred transport.
- Mark as New
- Bookmark
- Subscribe
- Mute
- Subscribe to RSS Feed
- Permalink
- Report Inappropriate Content
01-25-2023 05:05 AM
thanks Dan. This is a good lead. We can work on building out some dashboards or processes using APIs.
Discover and save your favorite ideas. Come back to expert answers, step-by-step guides, recent topics, and more.
New here? Get started with these tips. How to use Community New member guide


