- Cisco Community
- Technology and Support
- Networking
- Switching
- High CPU utilization on 3650
- Subscribe to RSS Feed
- Mark Topic as New
- Mark Topic as Read
- Float this Topic for Current User
- Bookmark
- Subscribe
- Mute
- Printer Friendly Page
High CPU utilization on 3650
- Mark as New
- Bookmark
- Subscribe
- Mute
- Subscribe to RSS Feed
- Permalink
- Report Inappropriate Content
05-31-2015 05:05 PM - edited 03-10-2019 12:31 PM
Hi,
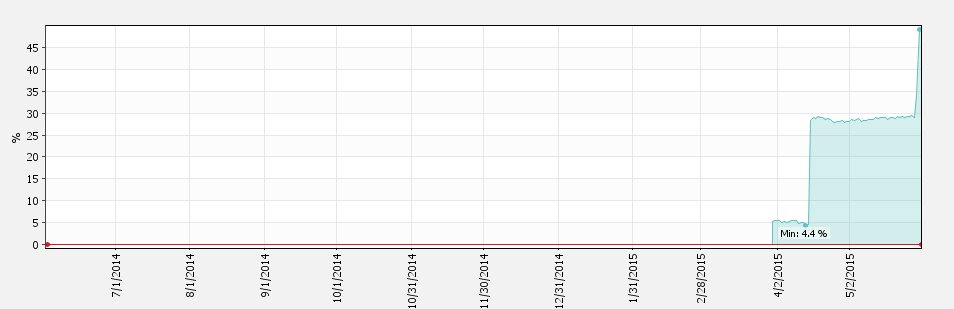
I have noticed that our cpu jumped from 10% to 30% instanlty and 2 days ago from 30% to 50%
Below the output:
Core 0: CPU utilization for five seconds: 77%; one minute: 83%; five minutes: 83%
Core 1: CPU utilization for five seconds: 20%; one minute: 30%; five minutes: 31%
Core 2: CPU utilization for five seconds: 14%; one minute: 54%; five minutes: 45%
Core 3: CPU utilization for five seconds: 88%; one minute: 34%; five minutes: 42%
PID Runtime(ms) Invoked uSecs 5Sec 1Min 5Min TTY Process
5669 3536943 21414829 270 25.74 25.44 25.46 1088 fed
6155 4254245 40425480 93 21.06 21.28 21.26 0 pdsd
8533 2769521 11307085 155 3.18 3.23 3.18 0 iosd
There is no debugs running, no L3 routing only L2 switching
Nothing has changed in the network when the cpu jumped...
Cant find any posts for pdsd that can explain why it is so high.
Below the switch version output
License Level: Ipbase
License Type: Permanent
Next reload license Level: Ipbase
cisco WS-C3650-24TS (MIPS) processor with 4194304K bytes of physical memory.
Processor board ID FDO1815Q0FJ
2 Virtual Ethernet interfaces
28 Gigabit Ethernet interfaces
2048K bytes of non-volatile configuration memory.
4194304K bytes of physical memory.
250456K bytes of Crash Files at crashinfo:.
1609272K bytes of Flash at flash:.
0K bytes of Dummy USB Flash at usbflash0:.
0K bytes of at webui:.
Base Ethernet MAC Address : xxxxxxxxxxxxxx
Motherboard Assembly Number : 73-15127-05
Motherboard Serial Number : xxxxxxxxxxx
Model Revision Number : A0
Motherboard Revision Number : A0
Model Number : WS-C3650-24TS
System Serial Number : FDO1815Q0FJ
Switch Ports Model SW Version SW Image Mode
------ ----- ----- ---------- ---------- ----
* 1 28 WS-C3650-24TS 03.03.03SE cat3k_caa-universalk9 INSTALL
Any help would be greatly appreciated!
Thanks,
Lefteris
- Labels:
-
Other Switching
- Mark as New
- Bookmark
- Subscribe
- Mute
- Subscribe to RSS Feed
- Permalink
- Report Inappropriate Content
06-01-2015 01:35 AM
Hi,
can you please print "show proc cpu detailed fed | ex 0.0" and "show proc cpu detailed psds | ex 0.0".
It seems that you've traffic being punted to the CPU.
See if this document helps:
http://www.cisco.com/c/en/us/support/docs/switches/catalyst-3850-series-switches/117594-technote-hicpu3850-00.html
BR.
- Mark as New
- Bookmark
- Subscribe
- Mute
- Subscribe to RSS Feed
- Permalink
- Report Inappropriate Content
06-01-2015 02:14 AM
Hi
CORE-SW01#show proc cpu detailed process fed | ex 0.0
Core 0: CPU utilization for five seconds: 80%; one minute: 80%; five minutes: 83%
Core 1: CPU utilization for five seconds: 16%; one minute: 18%; five minutes: 25%
Core 2: CPU utilization for five seconds: 9%; one minute: 19%; five minutes: 23%
Core 3: CPU utilization for five seconds: 95%; one minute: 83%; five minutes: 69%
PID T C TID Runtime(ms) Invoked uSecs 5Sec 1Min 5Min TTY Process
(%) (%) (%)
5669 L 3355375 217008429 272 25.7 25.4 25.4 1088 fed
5669 L 1 6104 349238 316146804 0 0.24 0.16 0.15 0 fed-ots-main
5669 L 1 6107 2932230 22575463 0 0.24 0.24 0.24 0 fed-ots-nfl
5669 L 3 9032 3476486 133166435 0 23.8 23.7 23.8 0 PunjectRx
5669 L 0 9033 672117 114199372 0 1.05 0.88 0.81 0 PunjectTx
AND
CORE-SW01#show proc cpu detailed process pdsd | ex 0.0
Core 0: CPU utilization for five seconds: 86%; one minute: 80%; five minutes: 82%
Core 1: CPU utilization for five seconds: 13%; one minute: 26%; five minutes: 33%
Core 2: CPU utilization for five seconds: 8%; one minute: 61%; five minutes: 32%
Core 3: CPU utilization for five seconds: 94%; one minute: 35%; five minutes: 54%
PID T C TID Runtime(ms) Invoked uSecs 5Sec 1Min 5Min TTY Process
(%) (%) (%)
6155 L 3748054 404995635 100 22.1 21.5 21.6 0 pdsd
6155 L 0 8451 700898 353312874 0 22.1 21.5 21.6 0 pdsd
Thanks!
- Mark as New
- Bookmark
- Subscribe
- Mute
- Subscribe to RSS Feed
- Permalink
- Report Inappropriate Content
06-01-2015 02:30 AM
You need to check the traffic that is being punted to the CPU. In the document that I sent you in the last post describes the way to capture some of this traffic, that way you can understand what is causing the high CPU.
- Mark as New
- Bookmark
- Subscribe
- Mute
- Subscribe to RSS Feed
- Permalink
- Report Inappropriate Content
06-01-2015 05:46 AM
Hi Norberto,
Thanks for the tip. I followed the steps on the link you sent me.
I discovered that the cpu is affected by a lot of arp requests coming from our edge device.
We have 16 /24 ranges with the edge device(s) being the gateway(s)
A lot of those IP addresses are vacant and when executing sh arp, we see a lot of incomplete mac addresses for those vacant IPs (expected)
The real question now is:
Why cant the switch handle those arp requests with a lower cpu load?
Is there a fix?
I removed some /24 prefixes from the edge devices to eliminate as much as possible the ar requests (this is the DMZ and we are being scanned 24x7) but I see very little improvement on the cpu load... (about 1%) although I did notice that the jumps were happening when ADDING a /24 prefix to the edge devices.
Pls dont tell me to reboot the core! :)
Any ideas? Is this behavior normal? Are we doing something wrong?
Again many many thanks for your support!
BR,
Lefteris
- Mark as New
- Bookmark
- Subscribe
- Mute
- Subscribe to RSS Feed
- Permalink
- Report Inappropriate Content
11-07-2016 06:20 PM
maybe ?
https://bst.cloudapps.cisco.com/bugsearch/bug/CSCux39490/?referring_site=bugquickviewclick
Discover and save your favorite ideas. Come back to expert answers, step-by-step guides, recent topics, and more.
New here? Get started with these tips. How to use Community New member guide