- Cisco Community
- Technology and Support
- Collaboration
- Collaboration Knowledge Base
- How to get a Packet Capture for Random failure.
- Subscribe to RSS Feed
- Mark as New
- Mark as Read
- Bookmark
- Subscribe
- Printer Friendly Page
- Report Inappropriate Content
- Subscribe to RSS Feed
- Mark as New
- Mark as Read
- Bookmark
- Subscribe
- Printer Friendly Page
- Report Inappropriate Content
11-04-2012 08:37 AM - edited 03-12-2019 09:55 AM
Scope
This document describes a series of recommendations and best practices from the TAC Center regarding troubleshooting a Unified Communications failure with a not-reproducible, hard to predict pattern that appears to behave as "random" in nature.
Introduction.
Some of the outmost complex problems faced by our customers and the TAC Center constitute problems that look random in nature. Although most issues can be traced back to a root cause that allows the problem to be reproduced with certainty, some issues are so complex and elusive that require to setup extensive monitoring to capture an instance of the problem during the troubleshooting process.
Problems like "random" TCP connection drops, that lead to phones unregistering, SDL links out of service usually require an extensive monitor until a instance of the issue reoccurs.
Coordination betwen multiple fundamental networking troubleshooting tools like SPAN sessions, and Protocol Analizers like http://www.wireshark.org/ allows to minimize the meantime to resolution for this type of issues.
Selecting the right capture point.
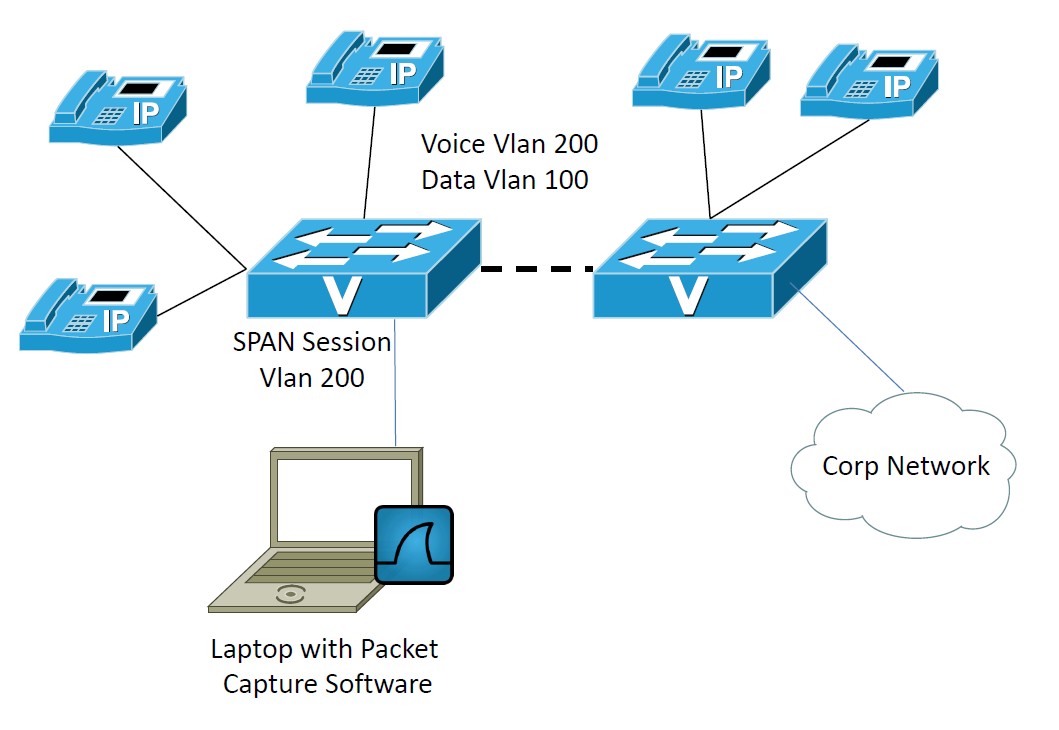
With Random issues it's hard to predict where is the next problem going to occure. If you monitor a specif port that port might not experience the issue again for an extended period. Therefore you should try to extend the statistical likelyhood of capturing an instance increasing the extend of the monitor. A viable option is to capture all traffic for a specific Vlan like the Voice VLAN, or the CUCM server vlan. Also monitoring the port for a WAN router might be suitable.
In this example we select to SPAN the entire both vlan, which will capture any instance affecting any of the IP Phones connected to the Switches. This would mean the next instance of the problem gets recorded and can be used for analysis.
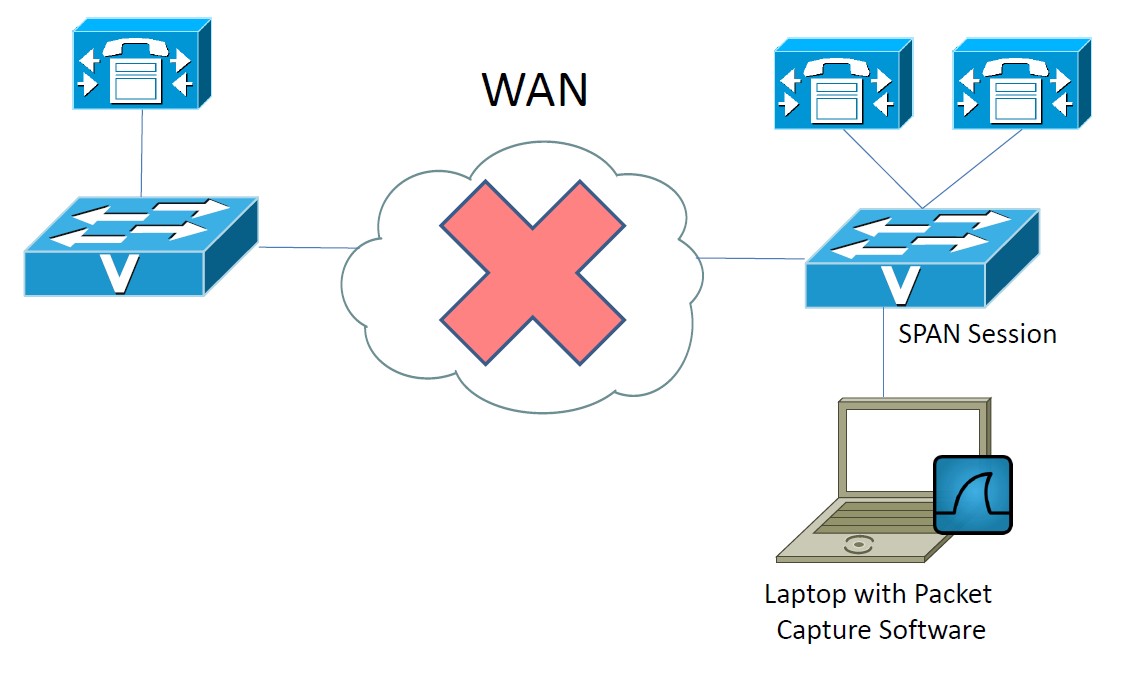
In this example Connectivity issues over the WAN are suspected and a SPAN is configured to monitor both ports for the CUCM servers at the main site. The capture will show what side is reseting the TCP connection, and other signs of networking problems like TCP Retransmition and QoS Remarking.
Setting up a SPAN.
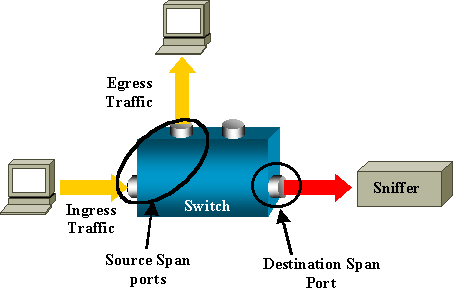
A Switched Port Analyzer, referenced as a SPAN constitues a fundamental element to troubleshoot this type of problems. The SPAN allows to monitor the traffic in and out of a "Device" ( Router, Phone, CUCM Server, Gateway... ) to be copied to an external element for analysis. The host is not impacted during the monitoring since the traffic is copied by the infraestructure without the "Device" been affected. It's one of the less intrusive troubleshoting that can be performed. Setting up a SPAN certantly requires a physical setup.
This link specified the configuration required on the Switch to enable the SPAN.
Setting Wireshark for a rolling capture.
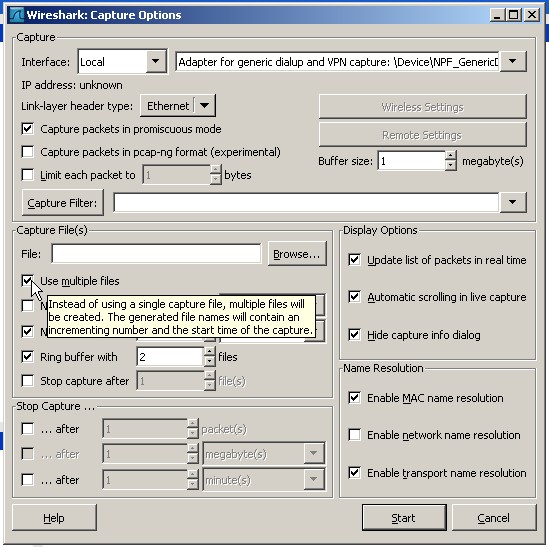
One of the common issues to gather a capture for an extended period is to brake down the large amount of data the sniffer will collect. Also wireshark normally stores the capture to RAM memory causing the program to become unresponsive once the OS available RAM is depleted. Wireshark can be configured to use mutiple files and break the capture in intervlan of minutes. This allows the retrival of the information to analyze to aproximate the time of the failure and focus only on that time.
Click on the "Show capture options" Menu.
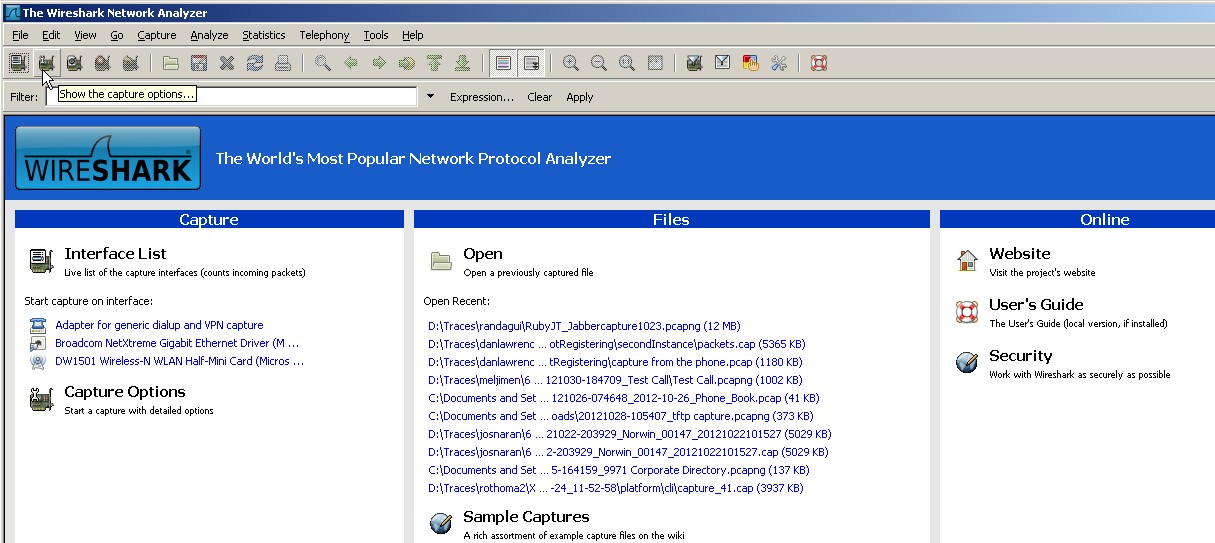
Check the "Use multiple files" option. The option of Next file Every X Minutes is the option that is more usefull.
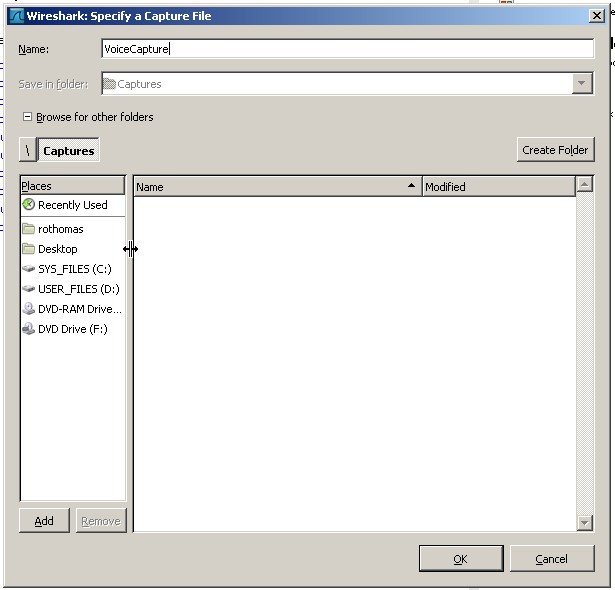
Select the folder where you want to store the capture. Consider enough disk space for the monitoring time.
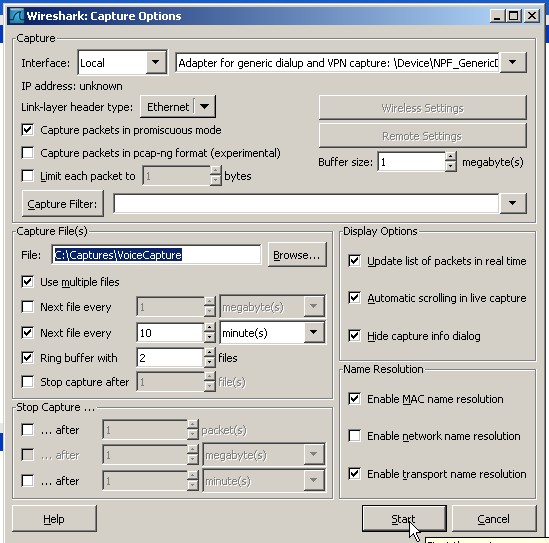
Make sure you are using the correct NIC for the capture and click on Start to initiate the capture.
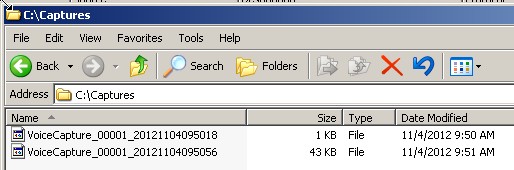
You will see the files been generated every 10 minutes at the destination specified.
Collect the relevant files.
Analyze information takes time. The more information that needs to be analyzed the longer the resolution will take. Breaking down the capture allows you to collect the files around 10, or 20 minutes around the issue.
Conclusions.
The issue might go for an extended period of days or even weeks under monitoring before manifesting again, but with this methodology it will allow you to get it recorded on the capture and aproximate the time for the failure for analysis.
- Mark as Read
- Mark as New
- Bookmark
- Permalink
- Report Inappropriate Content
Nice DOC!!! very useful.
- Mark as Read
- Mark as New
- Bookmark
- Permalink
- Report Inappropriate Content
Great Document! Thanks.
Find answers to your questions by entering keywords or phrases in the Search bar above. New here? Use these resources to familiarize yourself with the community: