Introduction
Traces provide detailed information about specific services and functions on Cisco Unified Communications Manager and that can be useful for troubleshooting call failures on the system.
This document covers the procedure on how to take a trace on Cisco Unified Communications Manager using Real-Time Monitoring Tool (RTMT)
RTMT is a tool that lets you monitor system health, view graphs and collect logs from Unified CM. There are versions for both Linux and Windows. Unified CM must also be configured to specify what can be traced.
Installing RTMT
1. Log in to Unified CM using a Linux or Windows PC.
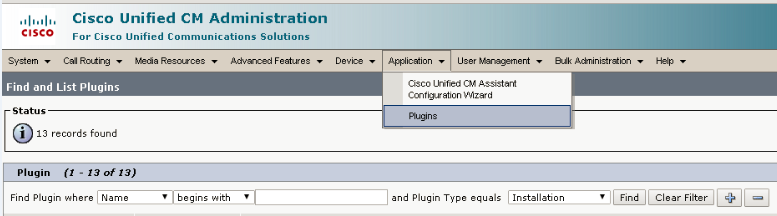
2. Go to Application > Plugins.
3. Select Find with ‘Name begins with "blank" and ‘Plugin Type equals "Installation".
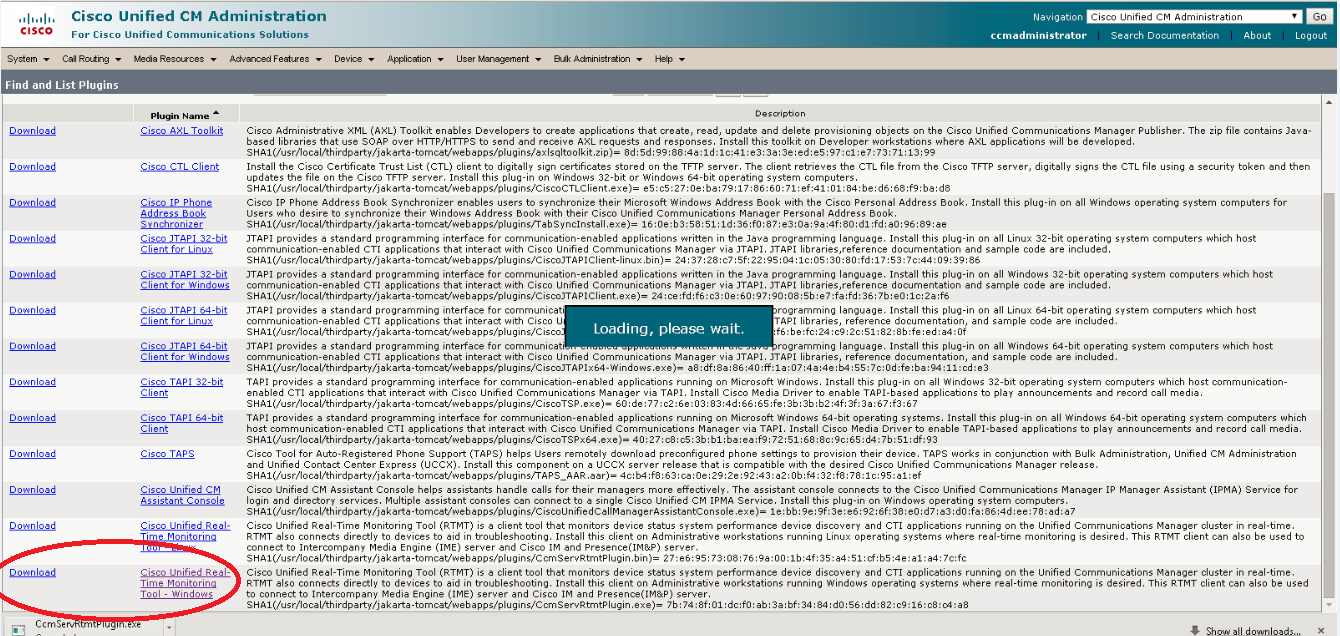
4. Scroll down to the entry for ‘Cisco Unified CM Real-Time Monitoring Tool – Windows’ or ‘Cisco Unified CM Real-Time Monitoring Tool – Linux’, as required.
5. Click on the Download link.
6. When downloaded, run the downloaded install file.
7. Follow the instructions in the install wizard.
8. When complete, click Done to exit the installer.
Running RTMT
1. Run RTMT. (For example, under windows this is in Start > All Programs > Cisco > CallManager
Serviceability > Real-Time Monitoring Tool.)
2. In the Login window enter the Host IP Address, User Name and Password.
3. Click OK.
Enable trace on Cisco Unified Communications Manager
1. Log in to Cisco Unified CM. First navigate to the Unified Serviceability page (https://cucm/ccmservice).
Go to Cisco Unified Serviceability.
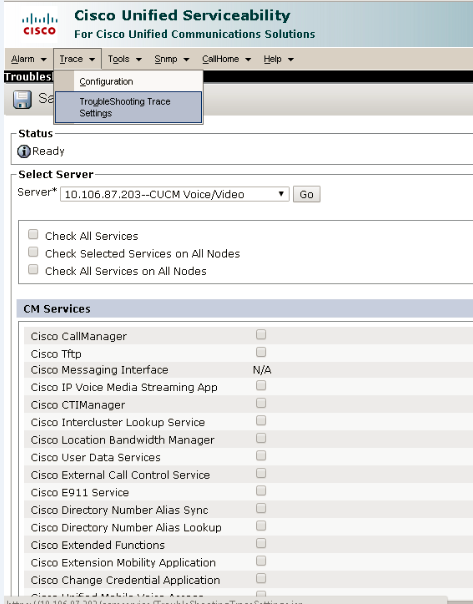
2. To Enable Traces, Go to the Troubleshooting Trace settings page, Click on Trace> Troubleshooting Trace settings:
3. Select the Check All Services check box.
4. Click Save.
Taking a trace using RTMT
1. Select Trace & Log Central.
2. Double-click on Real Time Trace.
3. Double-click View Real Time Data.
4. Select a Node – the Unified CM instance that is to have the trace run on it.
5. Click Next >.
6. Select the following:
l Products = UCM
l Services = Cisco CallManager
l Trace File Type = sdi
7. Click Finish.
The sdi (System Diagnostic Interface) trace contains alarms, error information and SIP stack trace information.
Related Information