- Cisco Community
- Technology and Support
- Networking
- Network Management
- Question about rttMonJitterStatsOWMinSDNew and rttMonJitterStatsOWMaxSDNew
- Subscribe to RSS Feed
- Mark Topic as New
- Mark Topic as Read
- Float this Topic for Current User
- Bookmark
- Subscribe
- Mute
- Printer Friendly Page
- Mark as New
- Bookmark
- Subscribe
- Mute
- Subscribe to RSS Feed
- Permalink
- Report Inappropriate Content
09-21-2011 07:51 AM
Hello there.
Quick question:
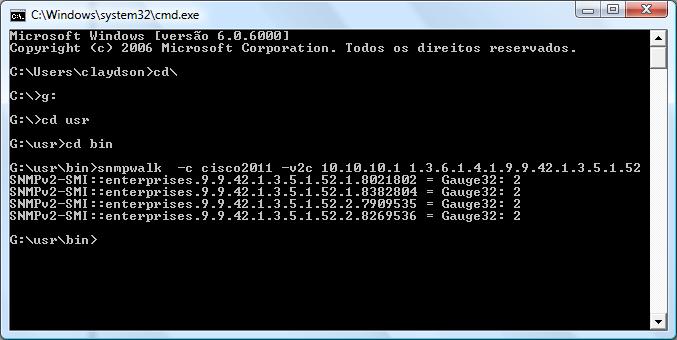
Both rttMonJitterStatsOWMinSDNew and rttMonJitterStatsOWMaxSDNew are showing random numbers in the end of the OID when I SNMP walk them. I'd like to understand what those numbers stands for.
Thanks!
Solved! Go to Solution.
- Labels:
-
Network Management
Accepted Solutions
- Mark as New
- Bookmark
- Subscribe
- Mute
- Subscribe to RSS Feed
- Permalink
- Report Inappropriate Content
09-21-2011 01:29 PM
First, for One Way Delay to be reported and accurate, you need to be using NTP between source and destination. Looks like you are but the min value falls below 1ms and its truncated to zero (0).
IP SLA keeps two buckets of data that the active probe reports data in a round robin fashion every hour. Actually, I think the new bucket is created and the old is destroyed every hour, actually. When this happens the index changes
1.3.6.1.4.1.9.9.42.1.3.5.1.52.1.8021802
OID = 1.3.6.1.4.1.9.9.42.1.3.5.1.52
rttMonCtrlAdminIndex = 1 (same as ip sla 1 , in the config)
rttMonJitterStatsStartTimeIndex = 8021802
There will be two instances of this index per probe, one bucket is actively written to and the
other has the previous one hour of data.
.1.3.6.1.4.1.9.9.42.1.3.5.1.1
rttMonJitterStatsStartTimeIndex OBJECT-TYPE
-- FROM CISCO-RTTMON-MIB
-- TEXTUAL CONVENTION TimeStamp
SYNTAX TimeTicks
MAX-ACCESS not-accessible
STATUS Current
DESCRIPTION "The time when this row was created."
::= { iso(1) org(3) dod(6) internet(1) private(4) enterprises(1) cisco(9) ciscoMgmt(9) ciscoRttMonMIB(42) ciscoRttMonObjects(1) rttMonStats(3) rttMonJitterStatsTable(5) rttMonJitterStatsEntry(1) 1 }
You really need to read the mib it will explain a lot of this.
- Mark as New
- Bookmark
- Subscribe
- Mute
- Subscribe to RSS Feed
- Permalink
- Report Inappropriate Content
09-21-2011 08:06 AM
To determine the index used by the object you have to read the MIB. They are located at
ftp://ftp.cisco.com/pub/mibs/v2
Search for the object and find the table it belongs to and scroll up to see the table entry definition, it will contain an entry for INDEX
rttMonJitterStatsEntry OBJECT-TYPE
    SYNTAX          RttMonJitterStatsEntry
    MAX-ACCESS      not-accessible
    STATUS          current
    DESCRIPTION
        "A list of objects which accumulate the results of a
        series of RTT operations over a 60 minute time period.

        This entry is created only if the rttMonCtrlAdminRttType
        is jitter. The operation of this table is same as that of
        rttMonStatsCaptureTable."
    INDEX           {
                        rttMonCtrlAdminIndex,
                        rttMonJitterStatsStartTimeIndex
                    }
    ::= { rttMonJitterStatsTable 1 }
So the index is made up of two parts
rttMonCtrlAdminIndex,
rttMonJitterStatsStartTimeIndex
- Mark as New
- Bookmark
- Subscribe
- Mute
- Subscribe to RSS Feed
- Permalink
- Report Inappropriate Content
09-21-2011 09:57 AM
Thanks for your reply.
I'm quite new in SNMP stuff. Sorry if the question is too shallow...
This is about a new monitoring tool that my customer is about to create. Since this number is changing randomly, the application cannot perform a SNMP get without a SNMP walk first. As these operations are taking too much processing and we're configuring many different instances of IP SLA , we should have fixed numbers to gather the right information. Is that a way to get this regardless this number?
- Mark as New
- Bookmark
- Subscribe
- Mute
- Subscribe to RSS Feed
- Permalink
- Report Inappropriate Content
09-21-2011 10:45 AM
Hi Viavles,
Please check the description below for the OID.
The number that you are getting is the actual value of the OID that you are fetching and not any random value.
Basically this OID gives the minimum one way trip time of a packet from source to destination.
http://www.oidview.com/mibs/9/CISCO-RTTMON-MIB.html : This link lists all the OIDs present under RTTMOn MIB
http://tools.cisco.com/Support/SNMP/do/BrowseOID.do?local=en&translate=Translate&objectInput=rttMonJitterStatsOWMinSDNew : this link will give u details on the OID itself.
Object Information
| Specific Object Information |
|
Please rate helpful posts.
Ameya
- Mark as New
- Bookmark
- Subscribe
- Mute
- Subscribe to RSS Feed
- Permalink
- Report Inappropriate Content
09-21-2011 10:51 AM
Hi,
Also please share a normal ping response from your snmp manager to 10.10.10.1
i.e from the PC u ran snmpwalk.
Ameya
- Mark as New
- Bookmark
- Subscribe
- Mute
- Subscribe to RSS Feed
- Permalink
- Report Inappropriate Content
09-21-2011 11:10 AM
Hi, thanks for your reply.
Let me go back a little bit. Maybe I'm doing something wrong here.
this is the output of show ip sla monitor statistics:
Round trip time (RTT) Index 1
Latest RTT: 5 ms
Latest operation start time: 18:10:43.481 UTC Wed Sep 21 2011
Latest operation return code: OK
RTT Values
Number Of RTT: 1000
RTT Min/Avg/Max: 5/5/16 ms
Latency one-way time milliseconds
Number of one-way Samples: 1000
Source to Destination one way Min/Avg/Max: 2/2/7 ms
Destination to Source one way Min/Avg/Max: 2/2/14 ms
Jitter time milliseconds
Number of SD Jitter Samples: 999
Number of DS Jitter Samples: 999
Source to Destination Jitter Min/Avg/Max: 0/1/5 ms
Destination to Source Jitter Min/Avg/Max: 0/1/11 ms
Packet Loss Values
Loss Source to Destination: 0 Loss Destination to Source: 0
Out Of Sequence: 0 Tail Drop: 0 Packet Late Arrival: 0
Voice Score Values
Calculated Planning Impairment Factor (ICPIF): 0
Mean Opinion Score (MOS): 0
Number of successes: 143
Number of failures: 0
Operation time to live: Forever
I'm trying to grab the highlighted information and I was pretty sure I'm using the right oid. Am I wrong?
If this is the right one, I need to understand why I'm getting as results these weird oid like when I search
1.3.6.1.4.1.9.9.42.1.3.5.1.52.1 I get 1.3.6.1.4.1.9.9.42.1.3.5.1.52.1.8021802. I am asking this because for the other oids I searched I have not found this kind of result.
- Mark as New
- Bookmark
- Subscribe
- Mute
- Subscribe to RSS Feed
- Permalink
- Report Inappropriate Content
09-21-2011 01:29 PM
First, for One Way Delay to be reported and accurate, you need to be using NTP between source and destination. Looks like you are but the min value falls below 1ms and its truncated to zero (0).
IP SLA keeps two buckets of data that the active probe reports data in a round robin fashion every hour. Actually, I think the new bucket is created and the old is destroyed every hour, actually. When this happens the index changes
1.3.6.1.4.1.9.9.42.1.3.5.1.52.1.8021802
OID = 1.3.6.1.4.1.9.9.42.1.3.5.1.52
rttMonCtrlAdminIndex = 1 (same as ip sla 1 , in the config)
rttMonJitterStatsStartTimeIndex = 8021802
There will be two instances of this index per probe, one bucket is actively written to and the
other has the previous one hour of data.
.1.3.6.1.4.1.9.9.42.1.3.5.1.1
rttMonJitterStatsStartTimeIndex OBJECT-TYPE
-- FROM CISCO-RTTMON-MIB
-- TEXTUAL CONVENTION TimeStamp
SYNTAX TimeTicks
MAX-ACCESS not-accessible
STATUS Current
DESCRIPTION "The time when this row was created."
::= { iso(1) org(3) dod(6) internet(1) private(4) enterprises(1) cisco(9) ciscoMgmt(9) ciscoRttMonMIB(42) ciscoRttMonObjects(1) rttMonStats(3) rttMonJitterStatsTable(5) rttMonJitterStatsEntry(1) 1 }
You really need to read the mib it will explain a lot of this.
- Mark as New
- Bookmark
- Subscribe
- Mute
- Subscribe to RSS Feed
- Permalink
- Report Inappropriate Content
09-21-2011 02:38 PM
Thank you very much!
Discover and save your favorite ideas. Come back to expert answers, step-by-step guides, recent topics, and more.
New here? Get started with these tips. How to use Community New member guide
