- Cisco Community
- Technology and Support
- Security
- Network Security
- FTD CLI SSH Debugging
- Subscribe to RSS Feed
- Mark Topic as New
- Mark Topic as Read
- Float this Topic for Current User
- Bookmark
- Subscribe
- Mute
- Printer Friendly Page
- Mark as New
- Bookmark
- Subscribe
- Mute
- Subscribe to RSS Feed
- Permalink
- Report Inappropriate Content
09-22-2018 09:51 AM - edited 02-21-2020 08:16 AM
Hi,
I am trying to get some debugging done on my FTD via SSH, but it does not seem to work. Does FTD support debugging if done via SSH and issued under#system support diagnostic-cli || or do you have to use a console cable to see debug output?
Using #debug webvpn anyconnect 1 ||does not give me any output even though I connect with anyconnect. I do not want to use level 255 because of this bug: https://quickview.cloudapps.cisco.com/quickview/bug/CSCvk37890
Br
Alex
Solved! Go to Solution.
- Labels:
-
Firepower Threat Defense (FTD)
Accepted Solutions
- Mark as New
- Bookmark
- Subscribe
- Mute
- Subscribe to RSS Feed
- Permalink
- Report Inappropriate Content
09-23-2018 07:07 AM - edited 09-23-2018 07:37 AM
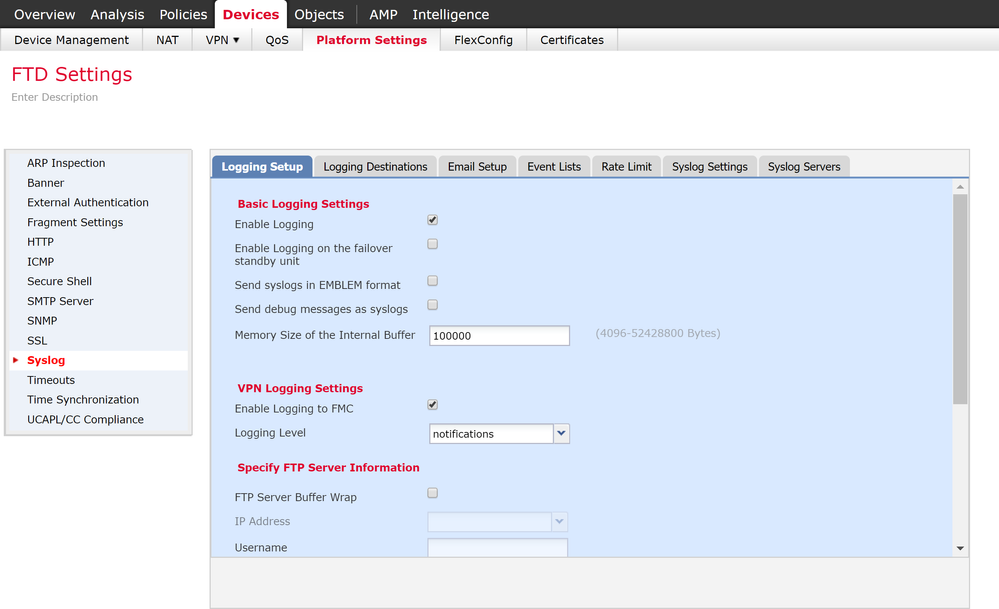
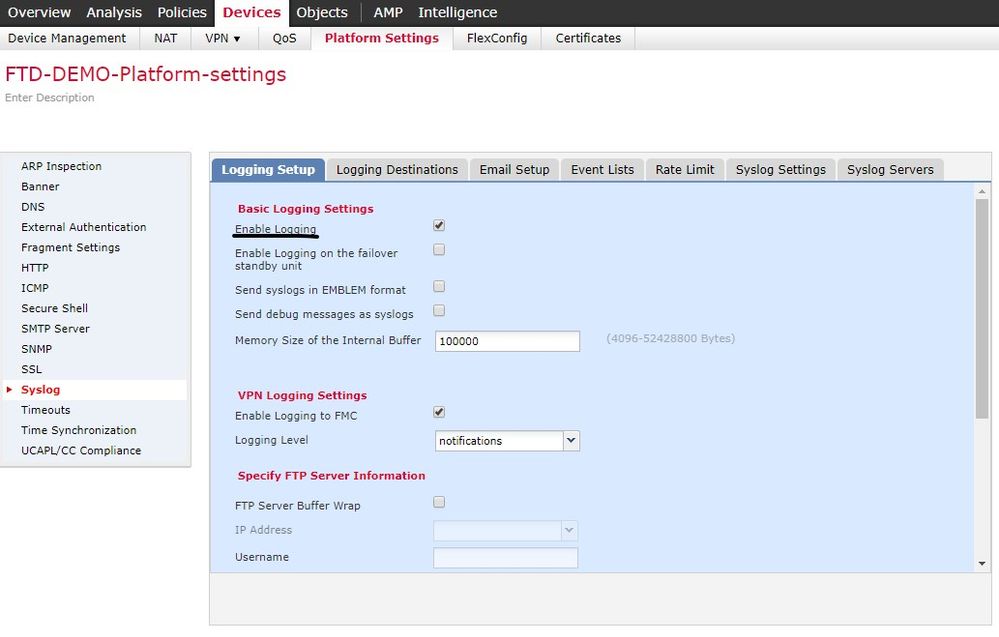
You have to first change the Platform settings to enable logging. That will get the debug output to appear on your ssh session. you can debug without conditional logging at all the various levels (1-255).
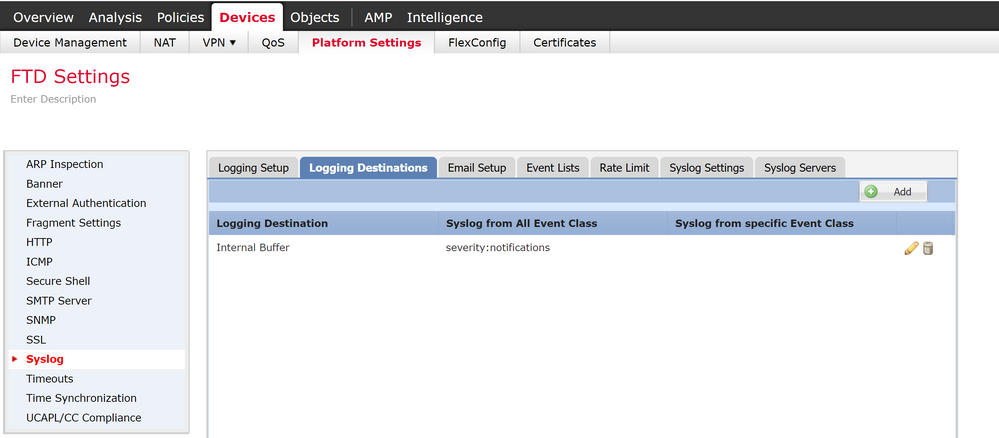
If you want save that output in your log buffer, choose the "debug logging buffered" equivalent in the FMC GUI. If you don't do that, the debug output will appear only on your current session in real time. If you do that you should set the buffer size above the default 4096 bytes. Otherwise the buffer only holds a couple dozen messages.
You can also set the VPN logging to go to FMC (at whatever severity level).
Deploy those changes and then run your debugs.
Here you can see the result before and after:
firepower# show logging
Syslog logging: disabled
    Facility: 20
    Timestamp logging: disabled
    Hide Username logging: enabled
    Standby logging: disabled
    Debug-trace logging: disabled
    Console logging: disabled
    Monitor logging: disabled
    Buffer logging: disabled
    Trap logging: disabled
    Permit-hostdown logging: disabled
    History logging: disabled
    Device ID: disabled
    Mail logging: disabled
    ASDM logging: disabled
    FMC logging: list MANAGER_VPN_EVENT_LIST, 99 messages logged
firepower#
firepower#
firepower# show logging
Syslog logging: enabled
    Facility: 20
    Timestamp logging: disabled
    Hide Username logging: enabled
    Standby logging: disabled
    Debug-trace logging: disabled
    Console logging: disabled
    Monitor logging: disabled
    Buffer logging: level notifications, 51 messages logged
    Trap logging: disabled
    Permit-hostdown logging: disabled
    History logging: disabled
    Device ID: disabled
    Mail logging: disabled
    ASDM logging: disabled
    FMC logging: list MANAGER_VPN_EVENT_LIST, 99 messages logged
<snip>
- Mark as New
- Bookmark
- Subscribe
- Mute
- Subscribe to RSS Feed
- Permalink
- Report Inappropriate Content
07-09-2019 06:37 AM
Hi,
I have the same problem.
I did as you pointed out step by step,
But I don't see real time syslog message on ssh session of ftd.
What swich on yet ?
- Mark as New
- Bookmark
- Subscribe
- Mute
- Subscribe to RSS Feed
- Permalink
- Report Inappropriate Content
07-09-2019 07:48 AM
Did you check on your syslog server (using wireshark or similar packet capture) for incoming packets from the FTD devices?
- Mark as New
- Bookmark
- Subscribe
- Mute
- Subscribe to RSS Feed
- Permalink
- Report Inappropriate Content
07-09-2019 08:33 PM
I don't use syslog server
I was want to see this message on ssh session in console.
- Mark as New
- Bookmark
- Subscribe
- Mute
- Subscribe to RSS Feed
- Permalink
- Report Inappropriate Content
07-10-2019 05:57 AM
@Milkhail the whole thread was about syslog monitoring.
To enable console logging choose that option in the platform settings. Deploy the change. Then log into your FTD appliance and drop from clish into the LINA module via the command "system support diagnostic-cli". Switch to enable mode.
At that point you should be seeing syslog messages as they occur being scrolled onto your console session.
Example from my FTDv:
> show running-config | include logg
logging enable
logging timestamp
logging list MANAGER_VPN_EVENT_LIST level informational class auth
logging list MANAGER_VPN_EVENT_LIST level informational class vpn
logging list MANAGER_VPN_EVENT_LIST level informational class vpnc
logging list MANAGER_VPN_EVENT_LIST level informational class vpnfo
logging list MANAGER_VPN_EVENT_LIST level informational class vpnlb
logging list MANAGER_VPN_EVENT_LIST level informational class webfo
logging list MANAGER_VPN_EVENT_LIST level informational class webvpn
logging list MANAGER_VPN_EVENT_LIST level informational class ca
logging list MANAGER_VPN_EVENT_LIST level informational class svc
logging list MANAGER_VPN_EVENT_LIST level informational class ssl
logging list MANAGER_VPN_EVENT_LIST level informational class dap
logging list MANAGER_VPN_EVENT_LIST level informational class ipaa
logging buffer-size 100000
logging console debugging
logging FMC MANAGER_VPN_EVENT_LIST
logging device-id hostname
logging host Inside-Lab 172.31.1.5
logging flash-minimum-free 1024
logging flash-maximum-allocation 3076
no logging message 106015
no logging message 313001
no logging message 313008
no logging message 106023
no logging message 710003
no logging message 106100
no logging message 302015
no logging message 302014
no logging message 302013
no logging message 302018
no logging message 302017
no logging message 302016
no logging message 302021
no logging message 302020
> system support diagnostic-cli
Attaching to Diagnostic CLI ... Press 'Ctrl+a then d' to detach.
Type help or '?' for a list of available commands.

vftd-new# Jul 10 2019 12:50:04 vftd-new : %FTD-7-111009: User 'enable_15' executed cmd: show logging queue
Jul 10 2019 12:50:20 vftd-new : %FTD-6-305012: Teardown dynamic UDP translation from Inside-Lab:172.31.1.10/123 to Outside-Home:192.168.0.204/123 duration 1:06:29
Jul 10 2019 12:50:23 vftd-new : %FTD-7-609002: Teardown local-host Outside-Home:52.21.117.50 duration 0:00:32
Jul 10 2019 12:50:24 vftd-new : %FTD-6-305012: Teardown dynamic TCP translation from Inside-Lab:172.31.1.10/47102 to Outside-Home:192.168.0.204/47102 duration 0:00:33
Jul 10 2019 12:50:36 vftd-new : %FTD-7-609001: Built local-host identity:fe80::1
Jul 10 2019 12:50:36 vftd-new : %FTD-7-609001: Built local-host Inside-Lab:ff02::1
Jul 10 2019 12:50:38 vftd-new : %FTD-7-609002: Teardown local-host identity:fe80::1 duration 0:00:02
Jul 10 2019 12:50:38 vftd-new : %FTD-7-609002: Teardown local-host Inside-Lab:ff02::1 duration 0:00:02
Jul 10 2019 12:50:51 vftd-new : %FTD-6-305011: Built dynamic TCP translation from Inside-Lab:172.31.1.10/47132 to Outside-Home:192.168.0.204/47132
Jul 10 2019 12:50:51 vftd-new : %FTD-7-609001: Built local-host Outside-Home:52.21.117
- Mark as New
- Bookmark
- Subscribe
- Mute
- Subscribe to RSS Feed
- Permalink
- Report Inappropriate Content
10-12-2022 08:40 AM
No, the whole thing was the OP wanted to get the Debug in his CLI.
- Mark as New
- Bookmark
- Subscribe
- Mute
- Subscribe to RSS Feed
- Permalink
- Report Inappropriate Content
02-04-2025 09:12 AM
This was incredibly helpful. Thank you!!
- Mark as New
- Bookmark
- Subscribe
- Mute
- Subscribe to RSS Feed
- Permalink
- Report Inappropriate Content
02-04-2025 07:42 PM
You're welcome @laurahood
- Mark as New
- Bookmark
- Subscribe
- Mute
- Subscribe to RSS Feed
- Permalink
- Report Inappropriate Content
09-28-2018 11:29 AM
You can do this from FMC in the platform settings but I would recommend to send debug logs to external syslog from the device.
br, Mikael
- Mark as New
- Bookmark
- Subscribe
- Mute
- Subscribe to RSS Feed
- Permalink
- Report Inappropriate Content
01-28-2020 03:30 AM
1. On FMC enable logging for FTD (Device->Platform Settings->New Policy or edit existing for Threat Defence)
Now on FTD cli after apply policy you will see:
> show logging
Syslog logging: enabled
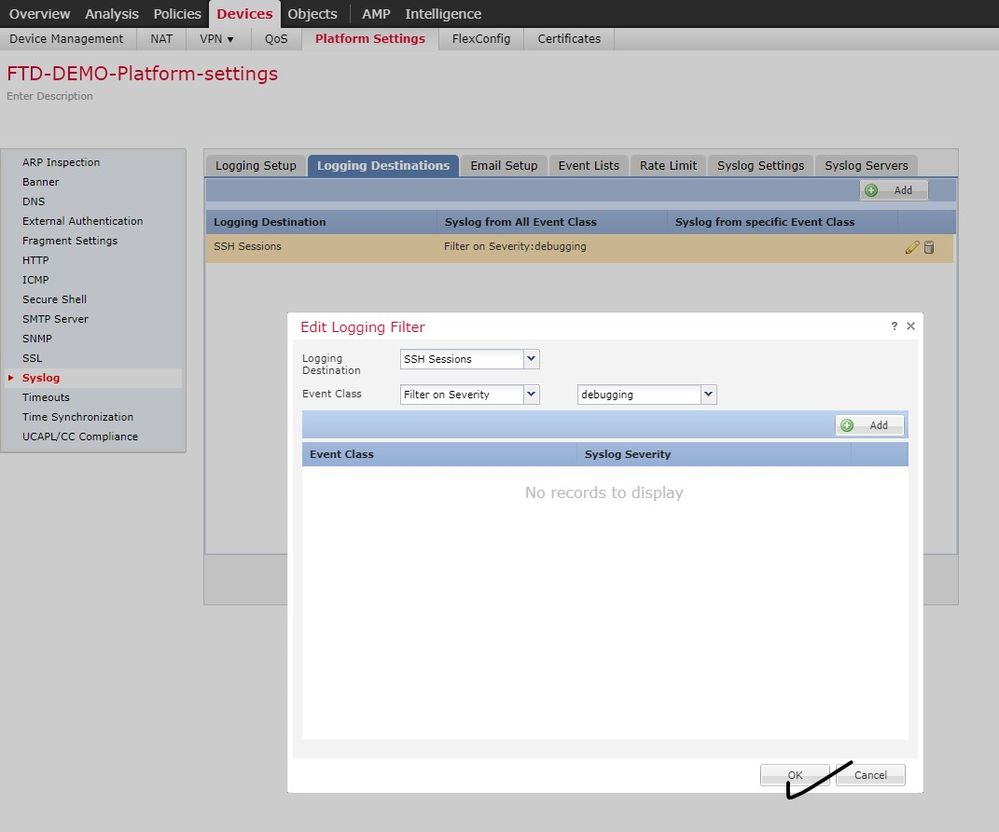
2. Enable ssh logging on FMC. Add rule for ssh logging on FTD.
After apply policy to FTD you will see monitor logging enabled:
> show logging
Syslog logging: enabled
Facility: 20
Timestamp logging: disabled
Hide Username logging: enabled
Standby logging: disabled
Debug-trace logging: disabled
Console logging: disabled
Monitor logging: level debugging, 18296 messages logged
3. Enter Lina
> system support diagnostic-cli
Attaching to Diagnostic CLI ... Press 'Ctrl+a then d' to detach.
Type help or '?' for a list of available commands.
testvpn> en
Password:
testvpn#
4. Debug your case
Example:
testvpn# debug crypto ikev1 1
testvpn# clear crypto ikev1 sa
testvpn# Jan 28 11:25:00 [IKEv1]Group = *.*.*.*, IP =*.*.*.*, Session is being torn down. Reason: Administrator Reset
I think that is clear how to do it 🙂
Discover and save your favorite ideas. Come back to expert answers, step-by-step guides, recent topics, and more.
New here? Get started with these tips. How to use Community New member guide


