Welcome to part 4 of the "APIC-EM API productivity series" for network engineers getting started in API and scripting.
Earlier blogs on APIC-EM covered
- /network-device – all attributes of network-devices
- /interface/network-device – all interfaces (and hosts) on a network-device e.g. a switch
- /license-info - all licencing information for a network-device
- /host?hostMac and /host?hostIP – parameterised search for an host by either MAC address or IP address.
By this stage of the blog series, I am going to assume you are familiar with swagger (API documentation tool) and the location of the github repository where I have shared the code samples (the GitHub location is at the bottom of the post).
#5 path trace
Path trace traces a path through the network from host A to host B. You can also provide TCP/UDP port information and the controller will look at points in the network where there is multiple paths and let you know which of the possible paths will be used for this flow.
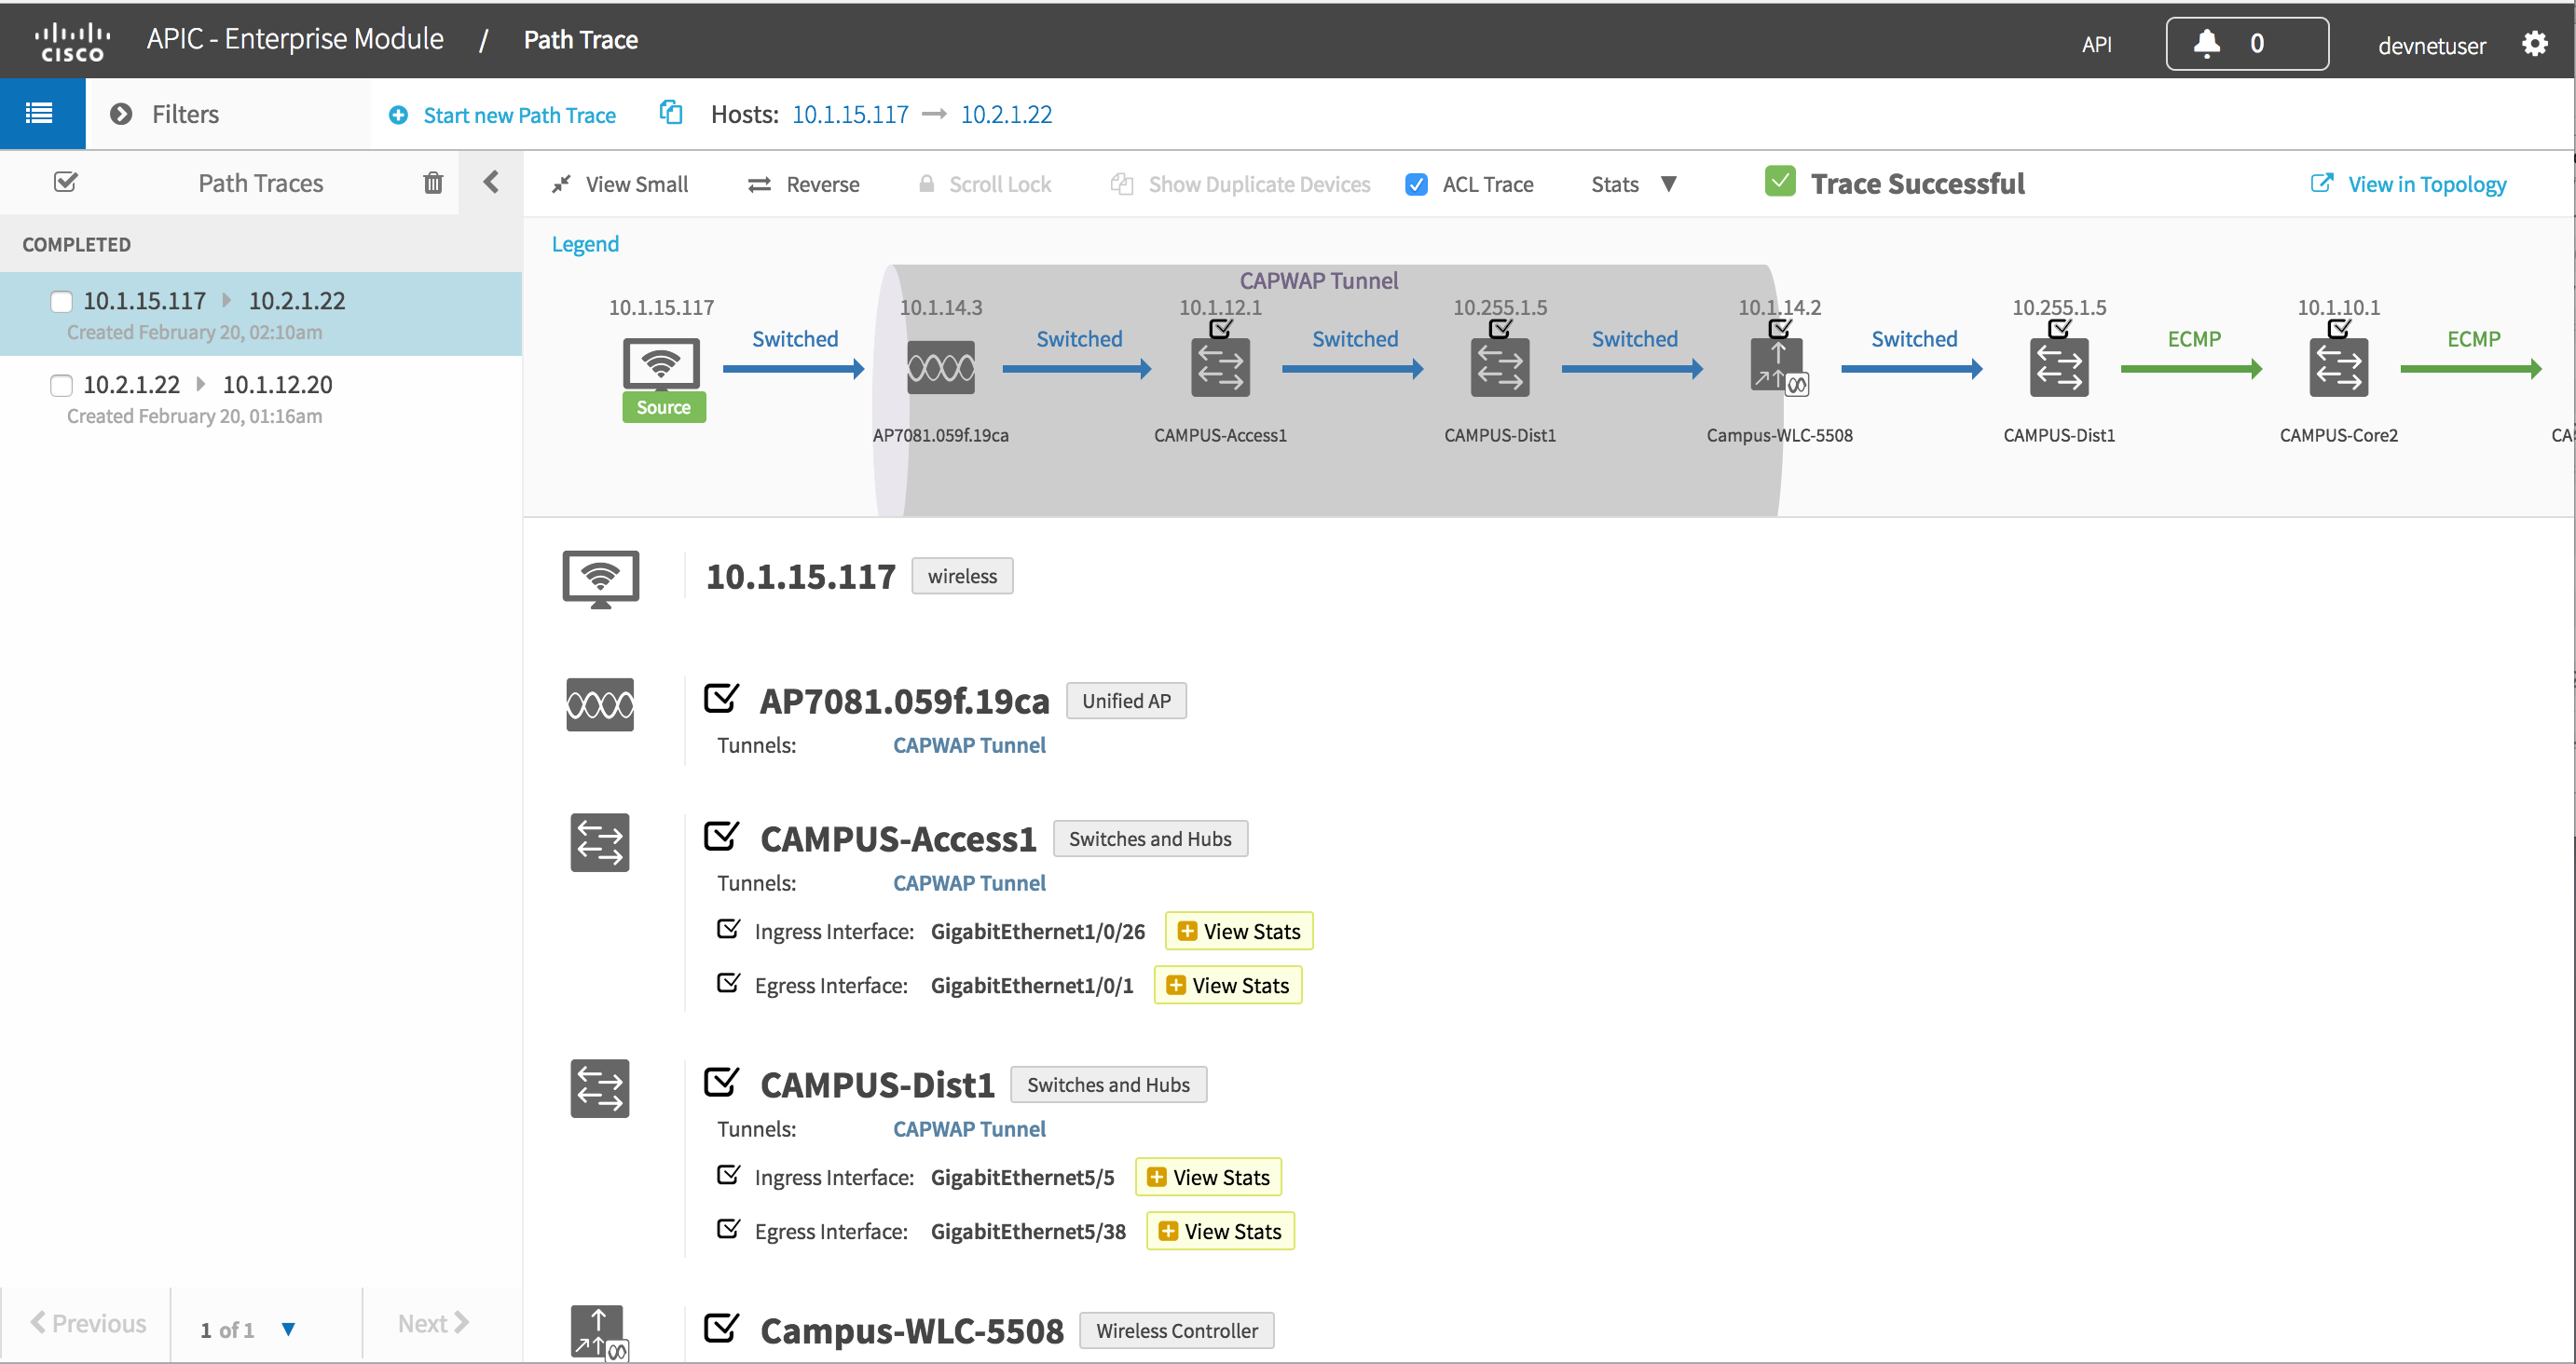
In addition you can get device and interface statistics along the active path. In release 1.2 this was been expanded to include performance monitor stats and ACL tracing.
Swagger
It is also possible to run a path trace through swagger. It is a little more complex than earlier examples as there are three steps involved.
The first big difference is that this requires a POST. We send data to APIC-EM to describe the path trace parameters, in this case just source and dest IP along with the "run stats commands". I am going to use the payload from the sample python script in the next section. You will need to paste in the following text into the text box shown in a red rectangle.
|
{"destIP": "10.2.1.22", "inclusions": ["INTERFACE-STATS", "DEVICE-STATS"], "sourceIP": "10.1.15.117", "periodicRefresh": false}
|
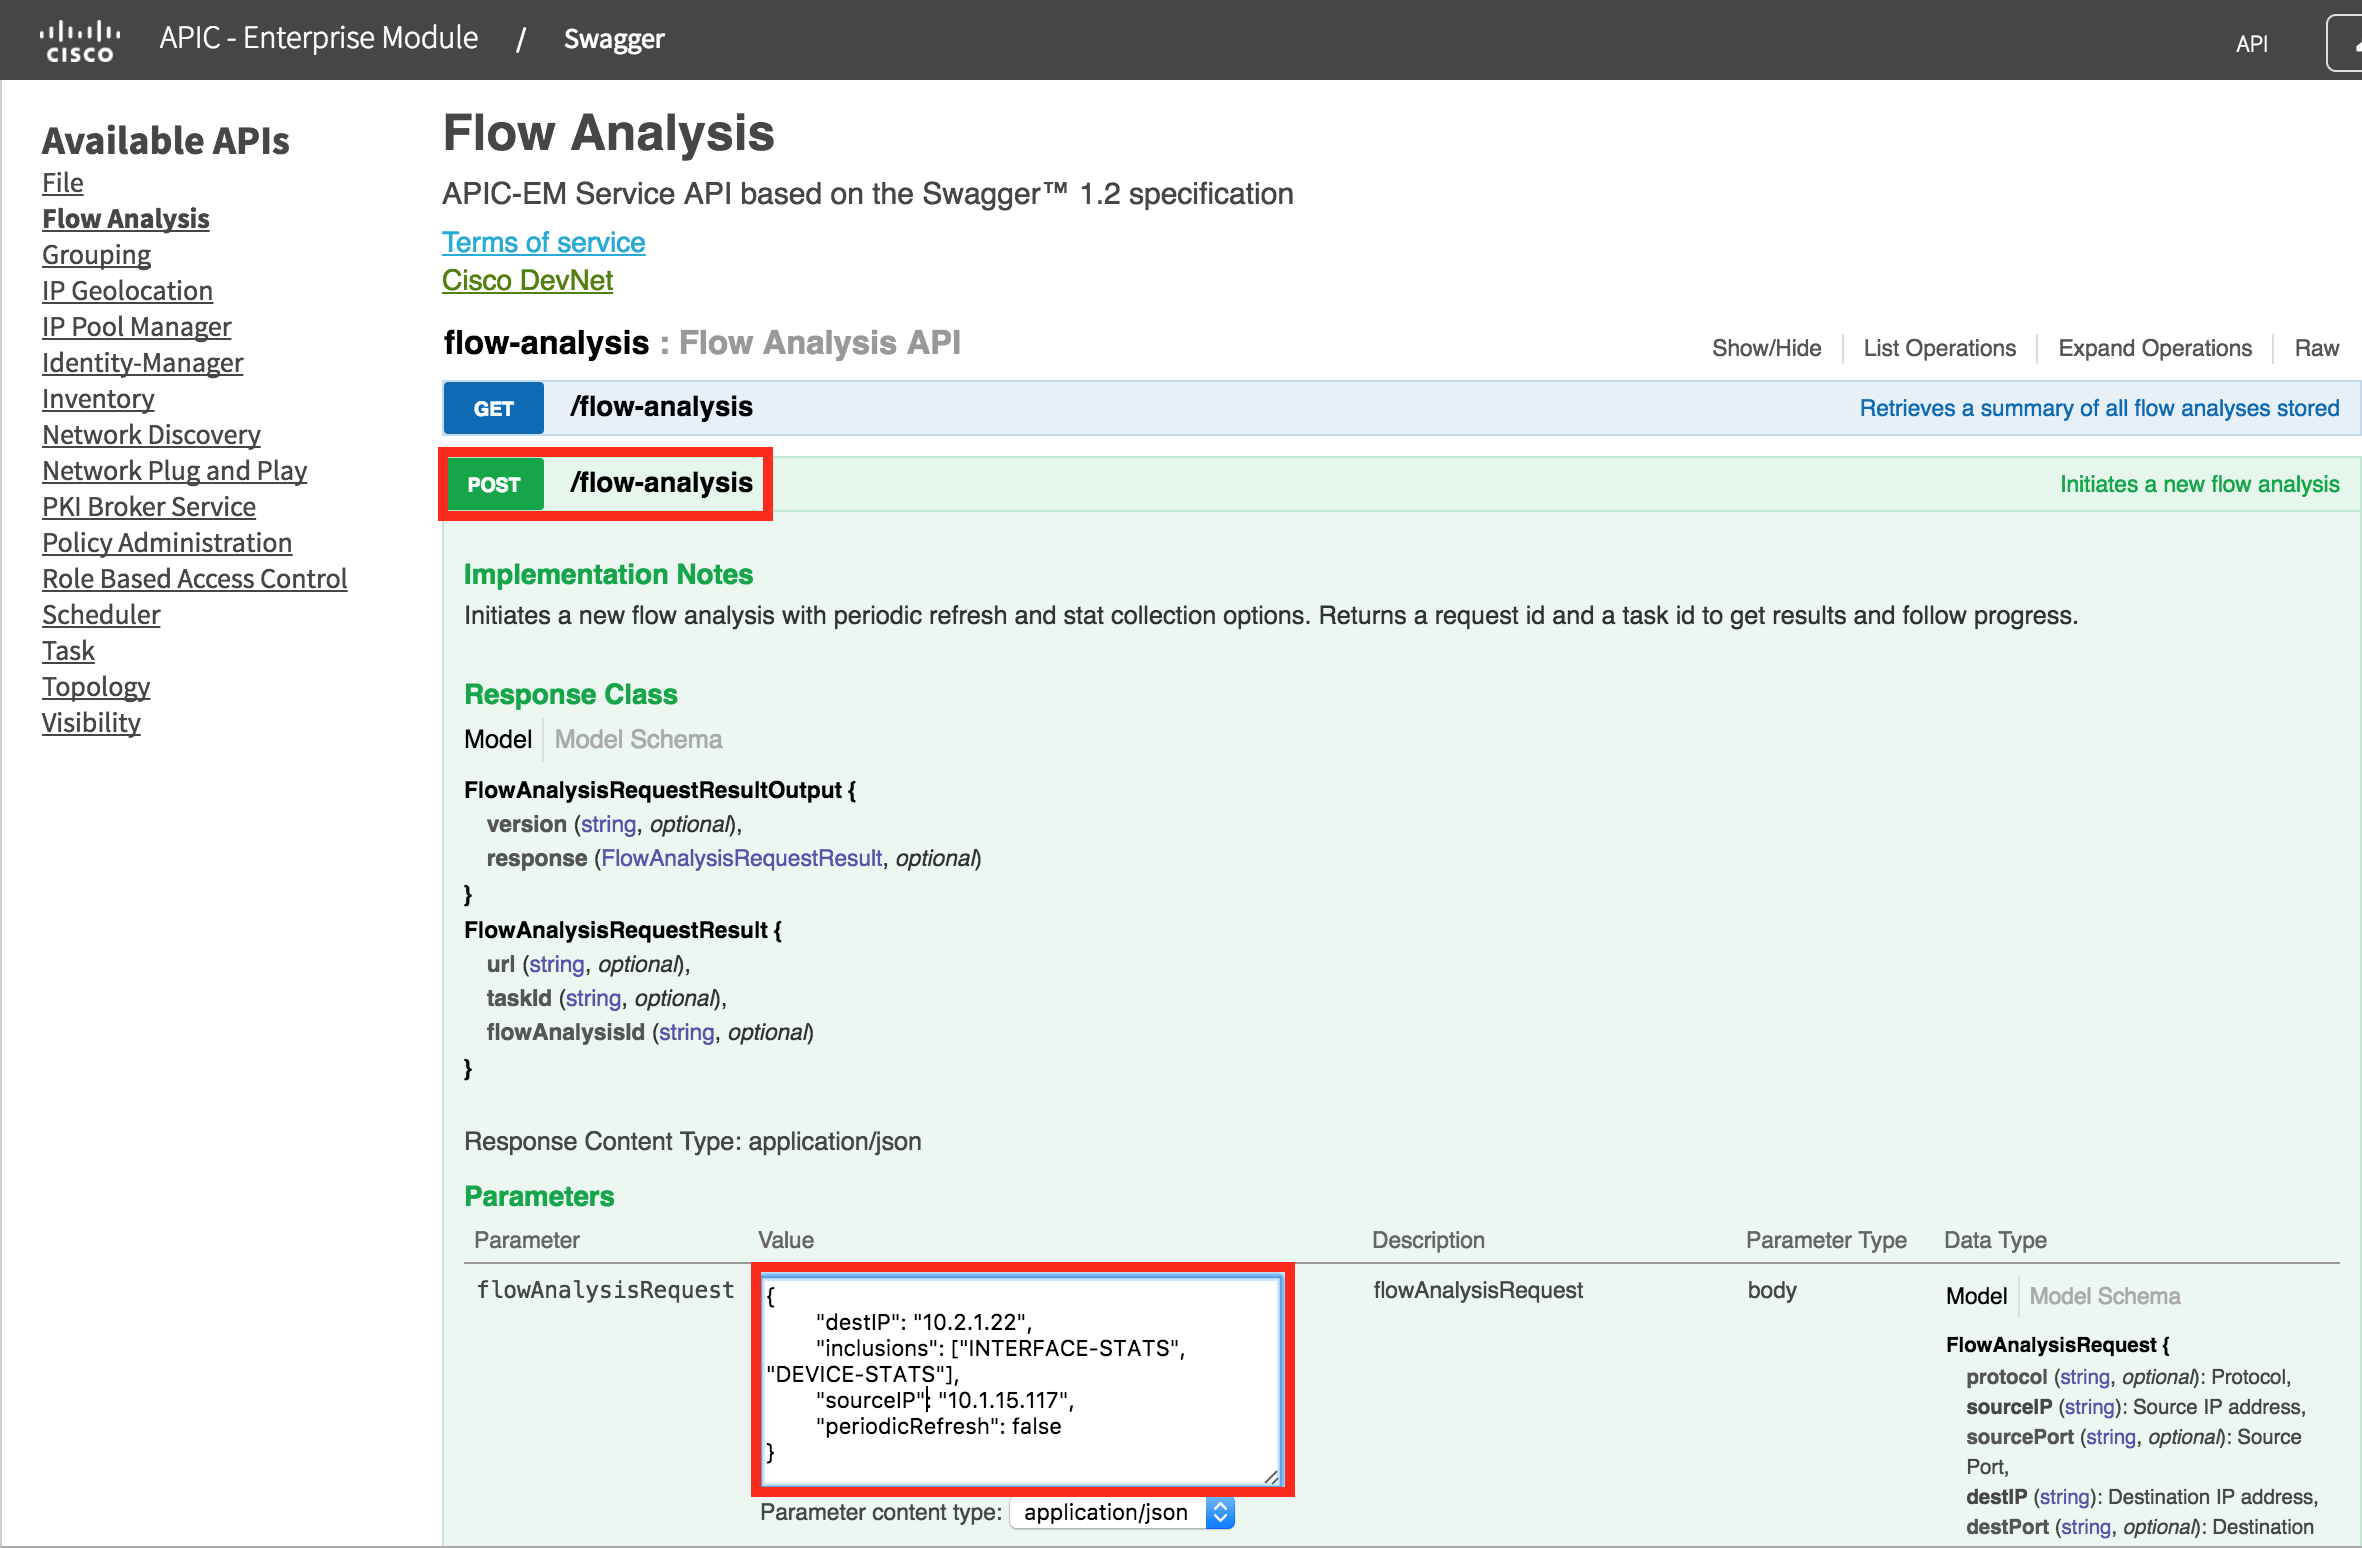
Then press "Try it Out"
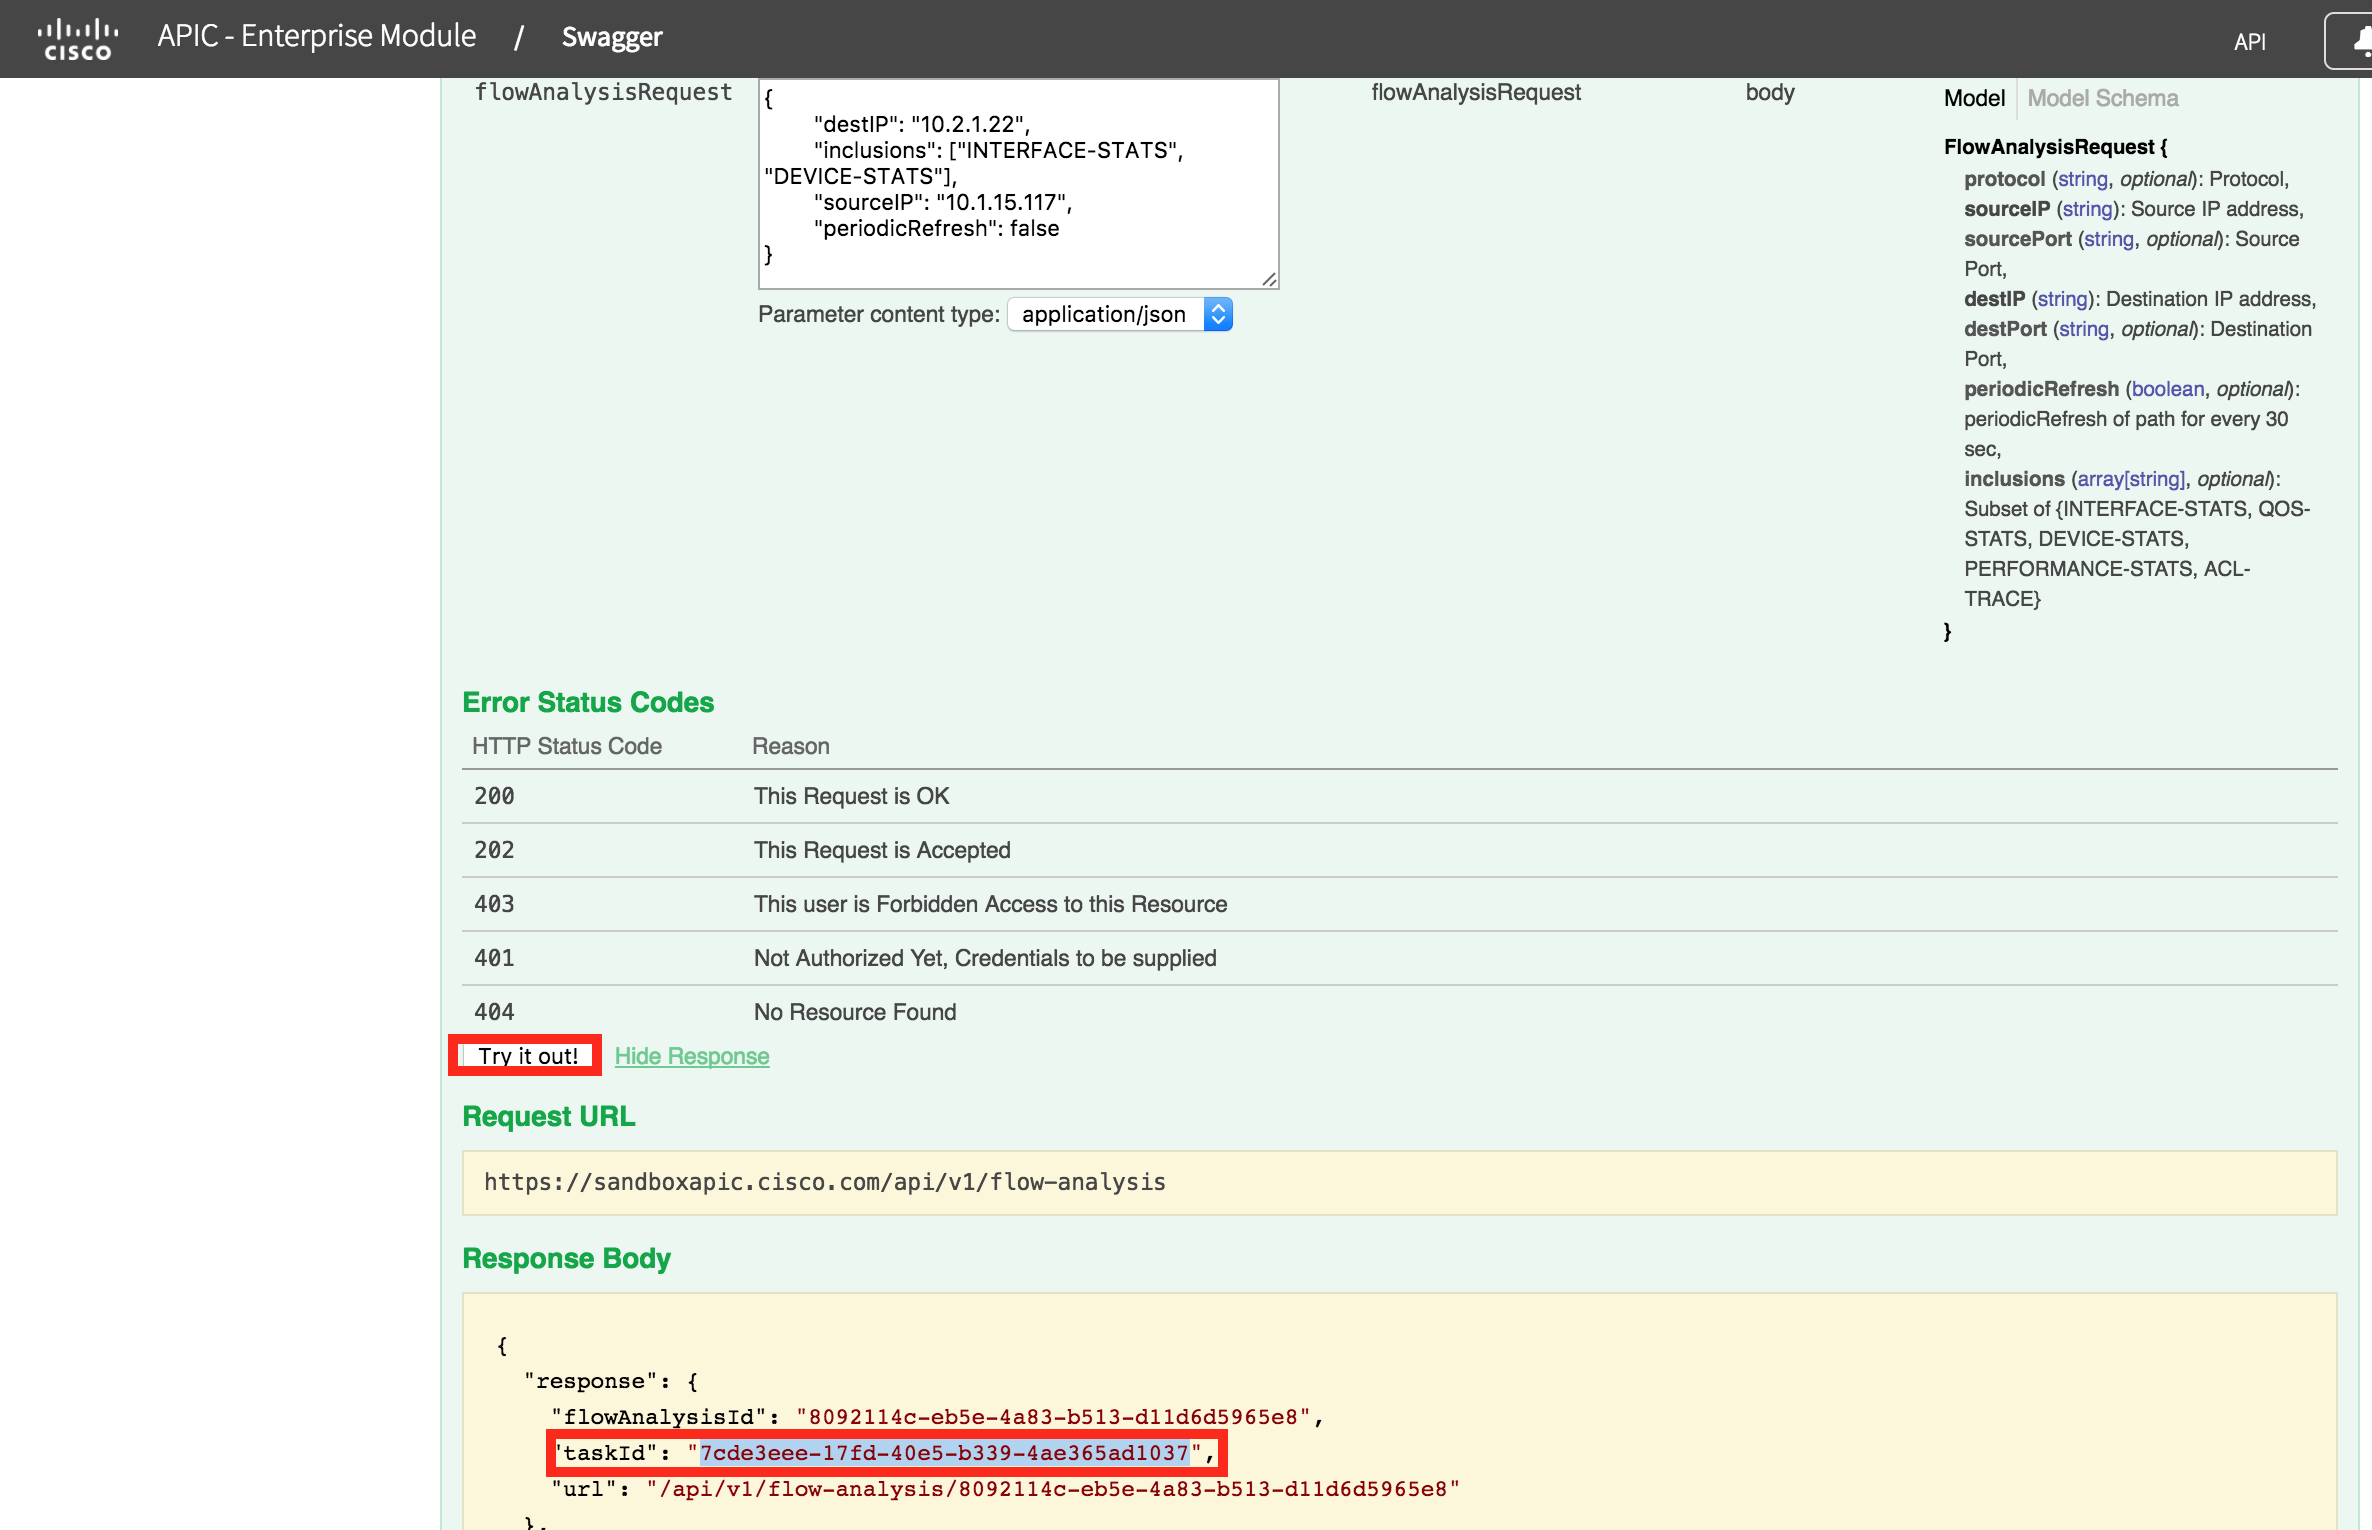
Notice the "taskId" 7cde3eee-17fd-40e5-b339-4ae365ad1037, this will be unique for each instance of path trace. This task needs to be polled until it completes. It should only take a few seconds.
To poll the task, use the /task/{taskId} GET request. Paste in the taskId (yours will be different), and press "Try it out"
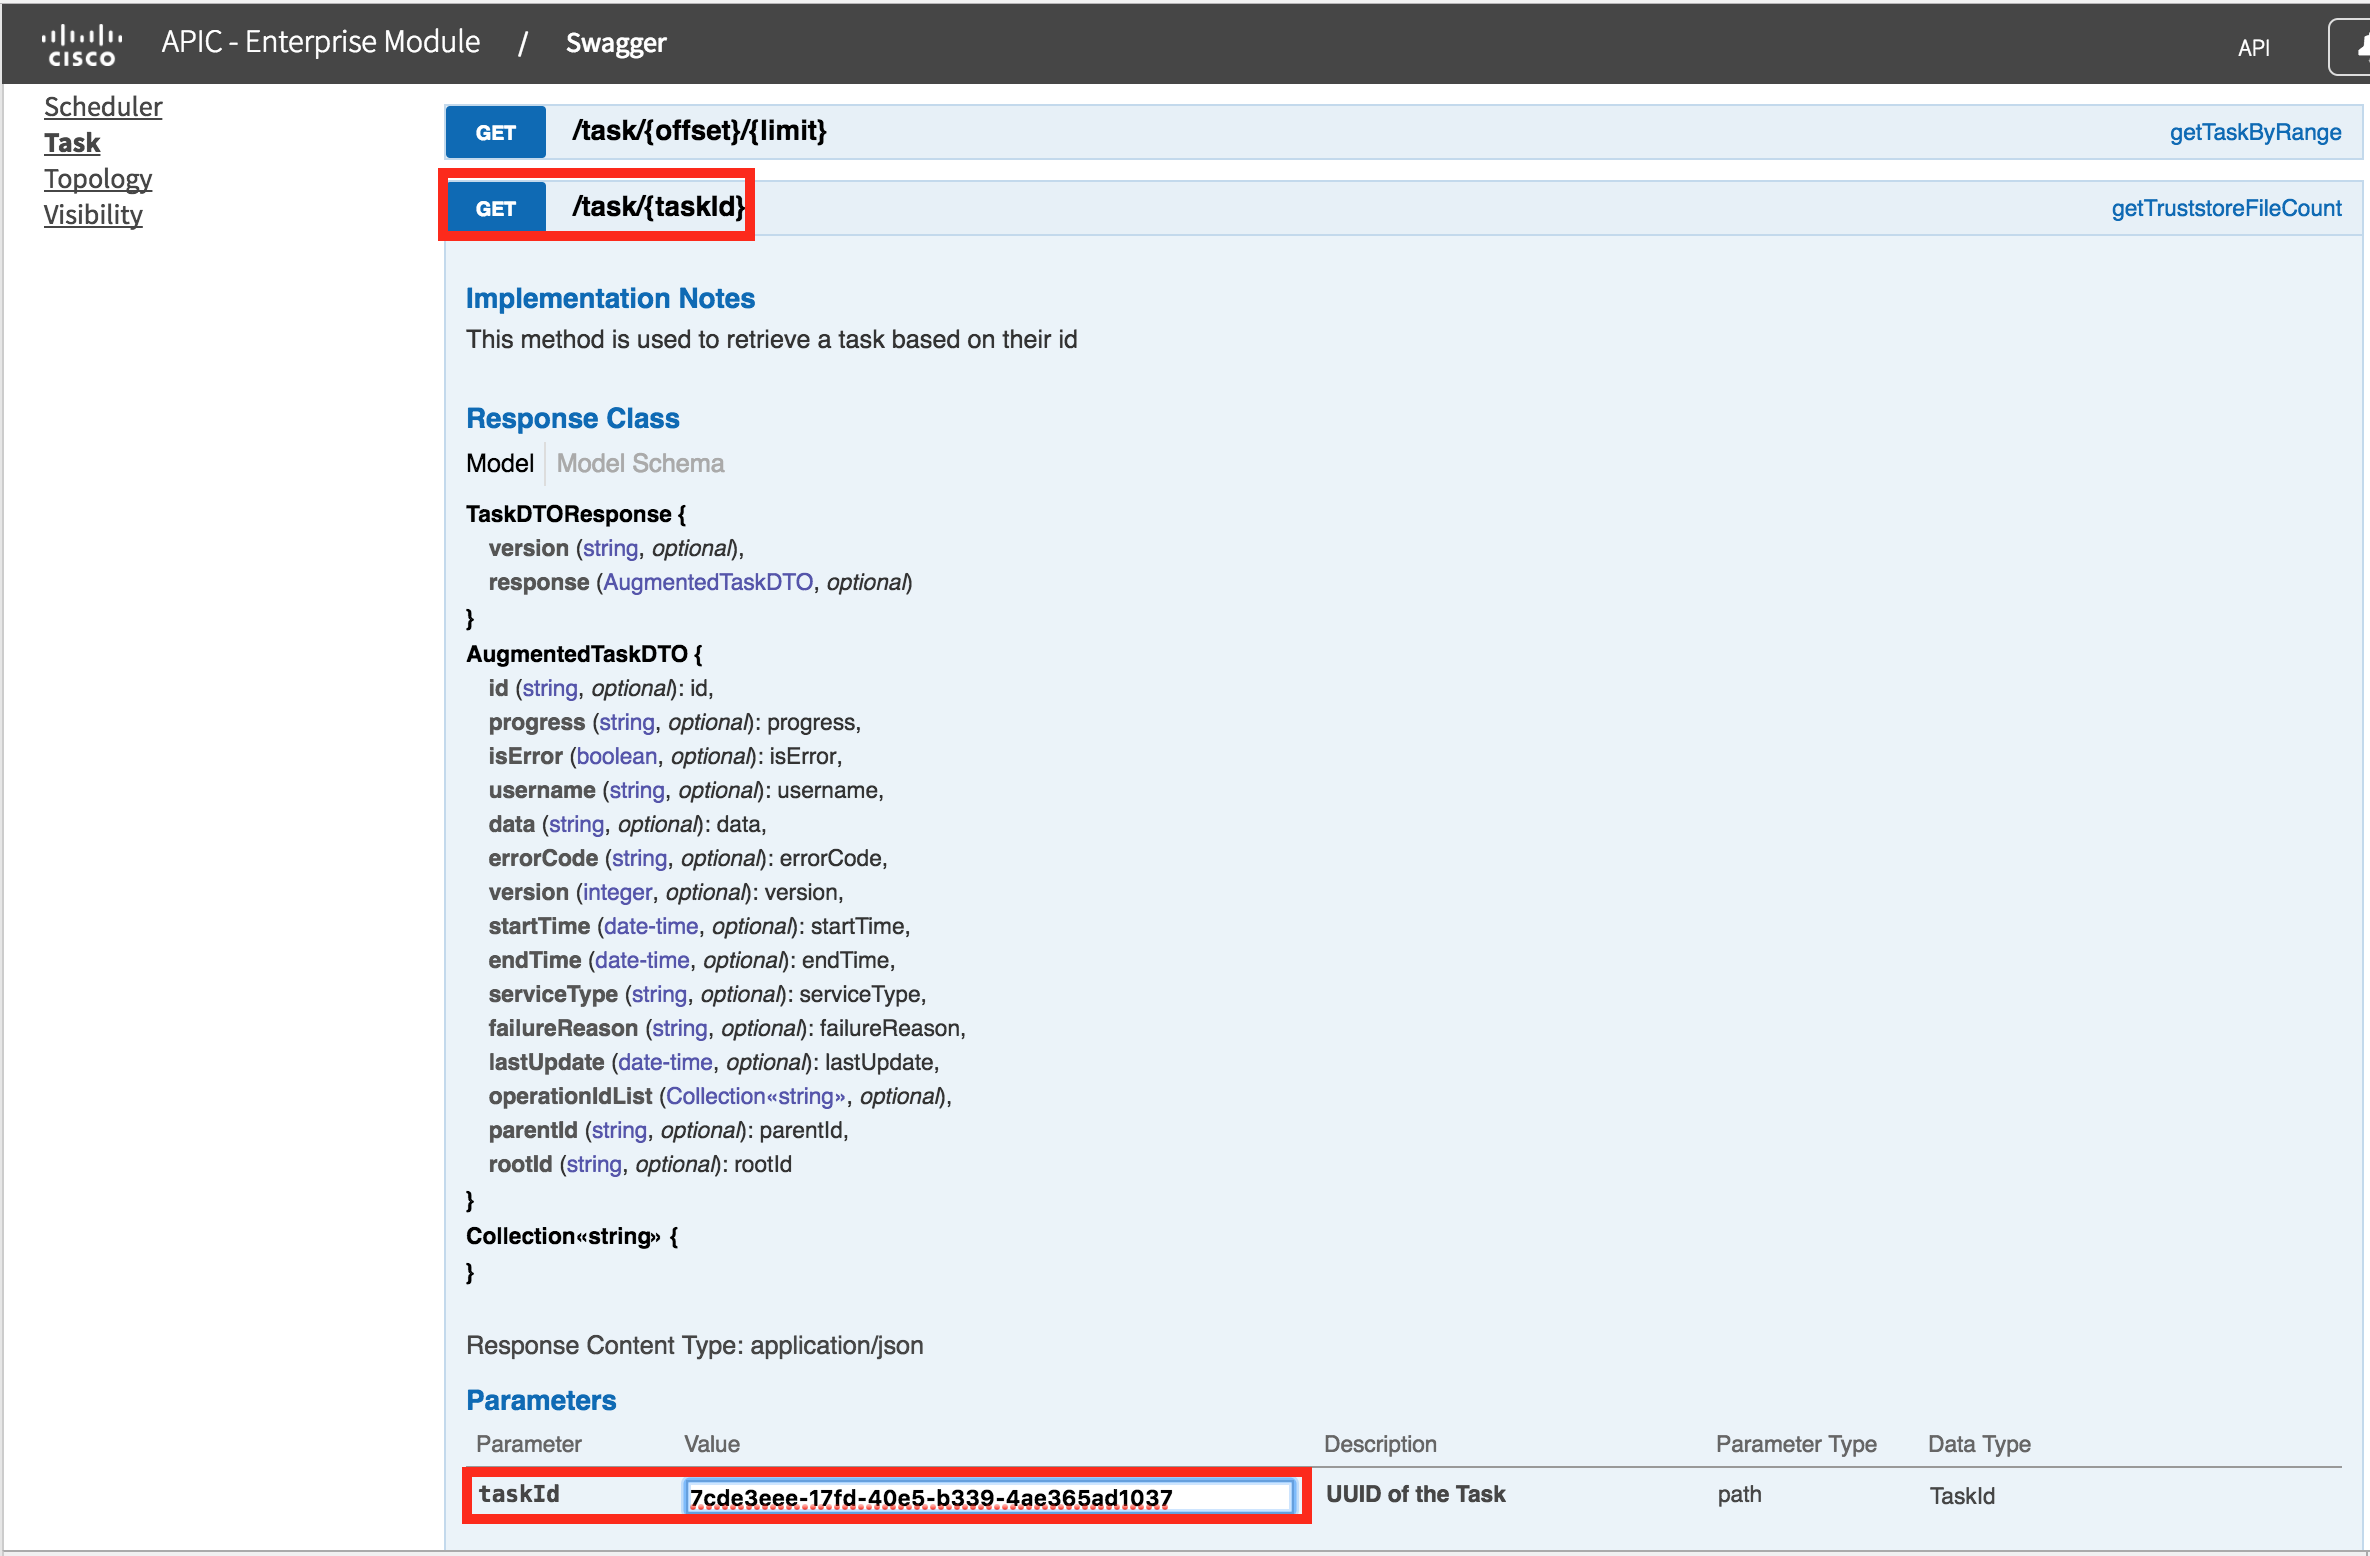
You will get a result similar to the following:
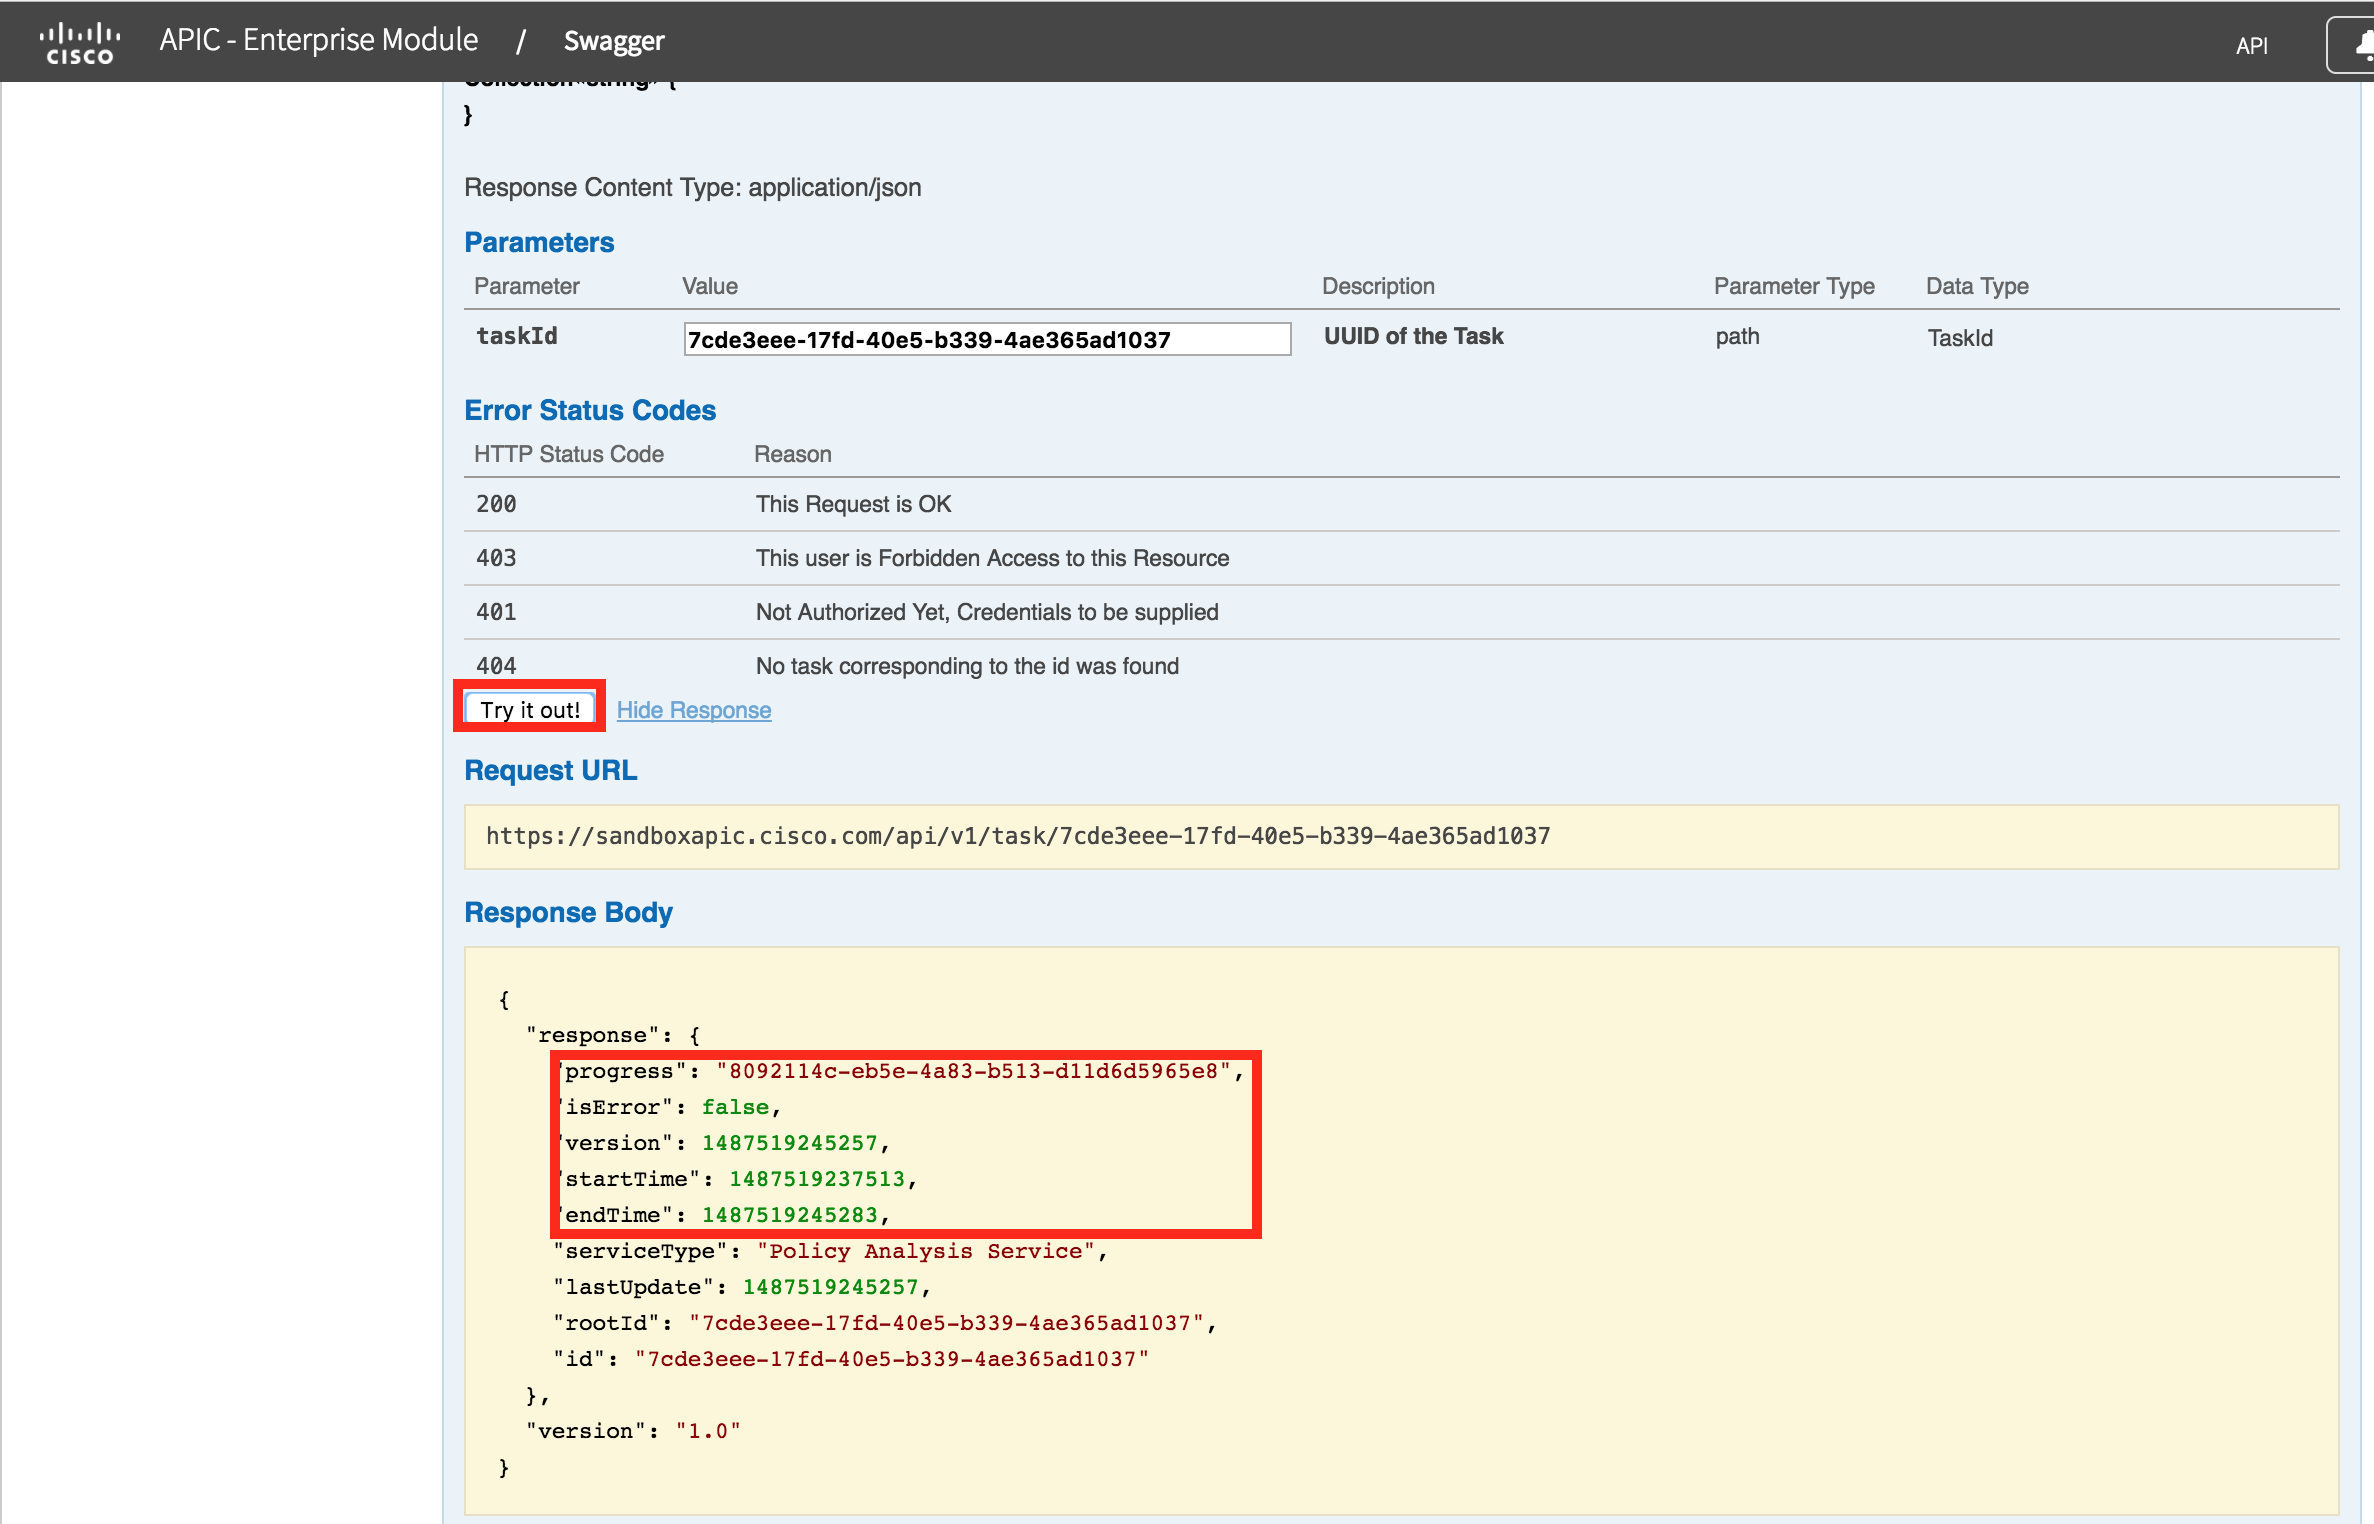
This shows the task is complete (it has an endTime), and has no errors (isError is false). The flowAnalysisId is in the "progress" attribute. The final step is to GET /flow-analysis/{flowAnalysisId}.
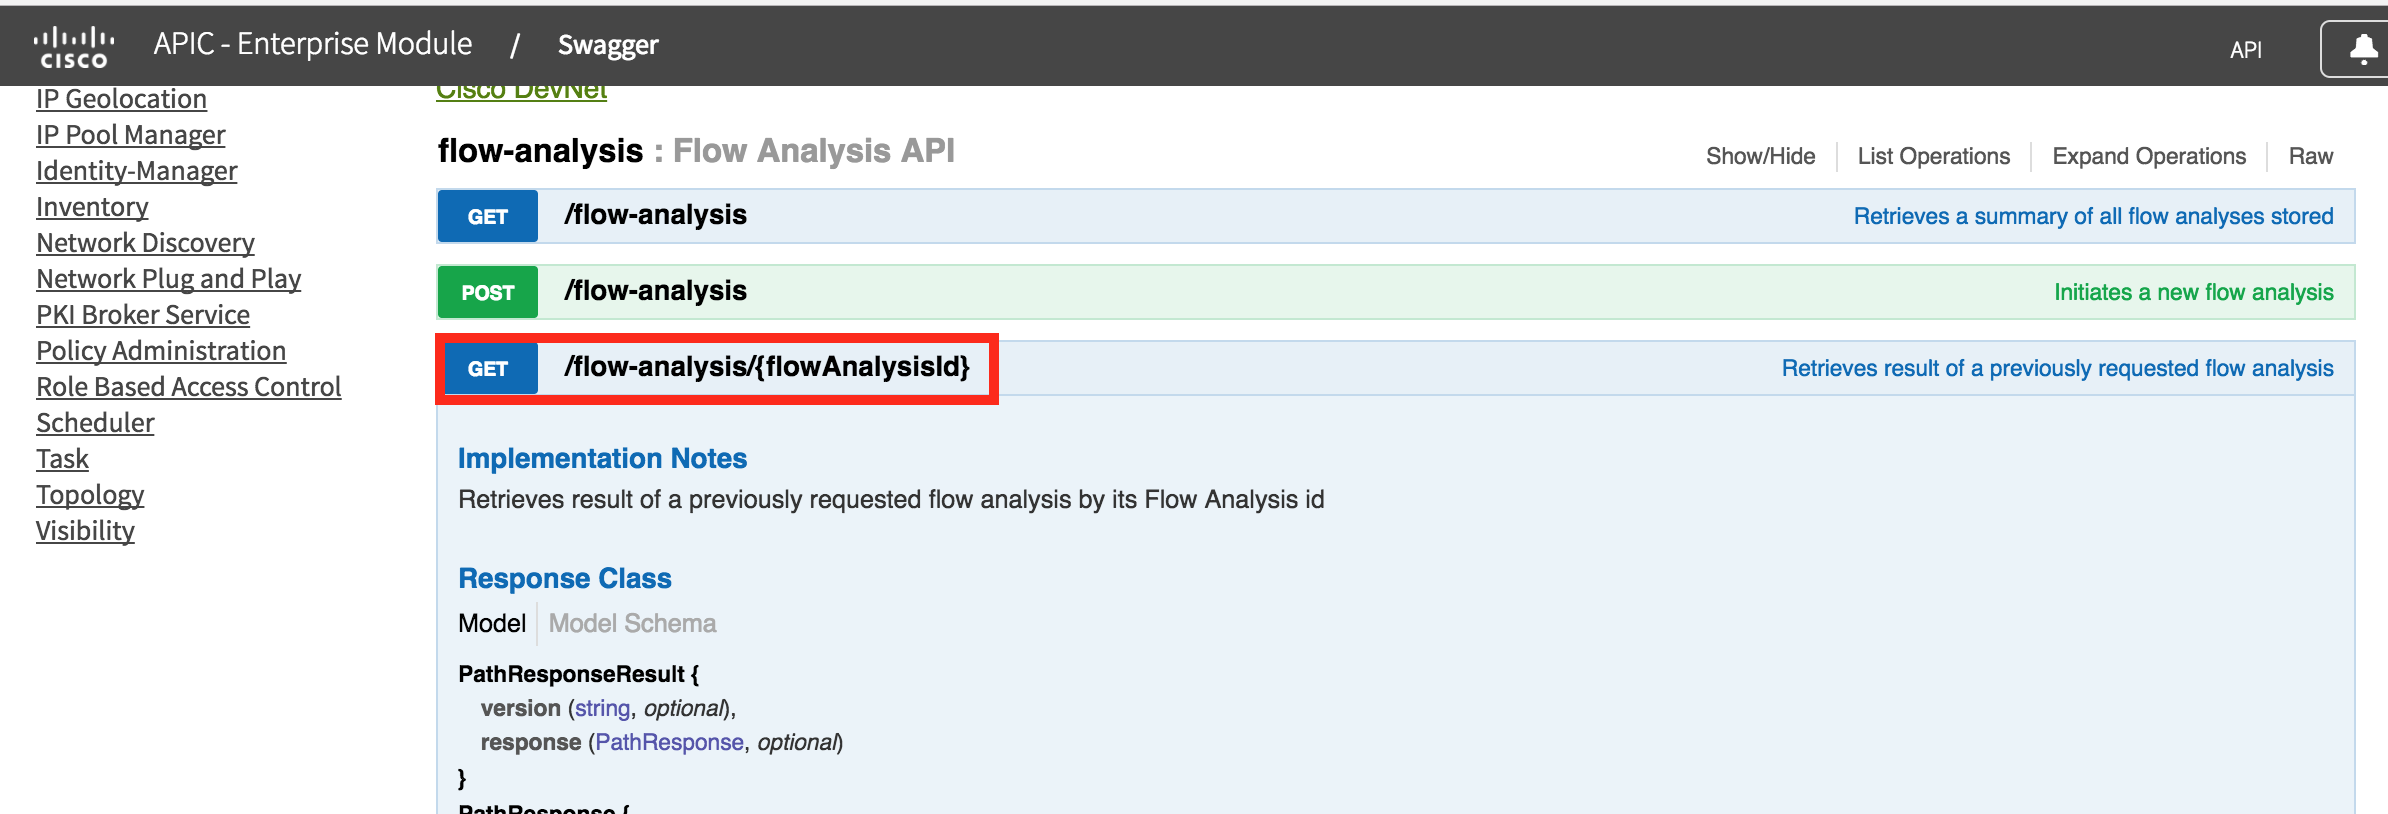
Use the flowAnalysisId from the task (yours will be different, unique to your system). Press "Try it out" and you will see the output from the request.
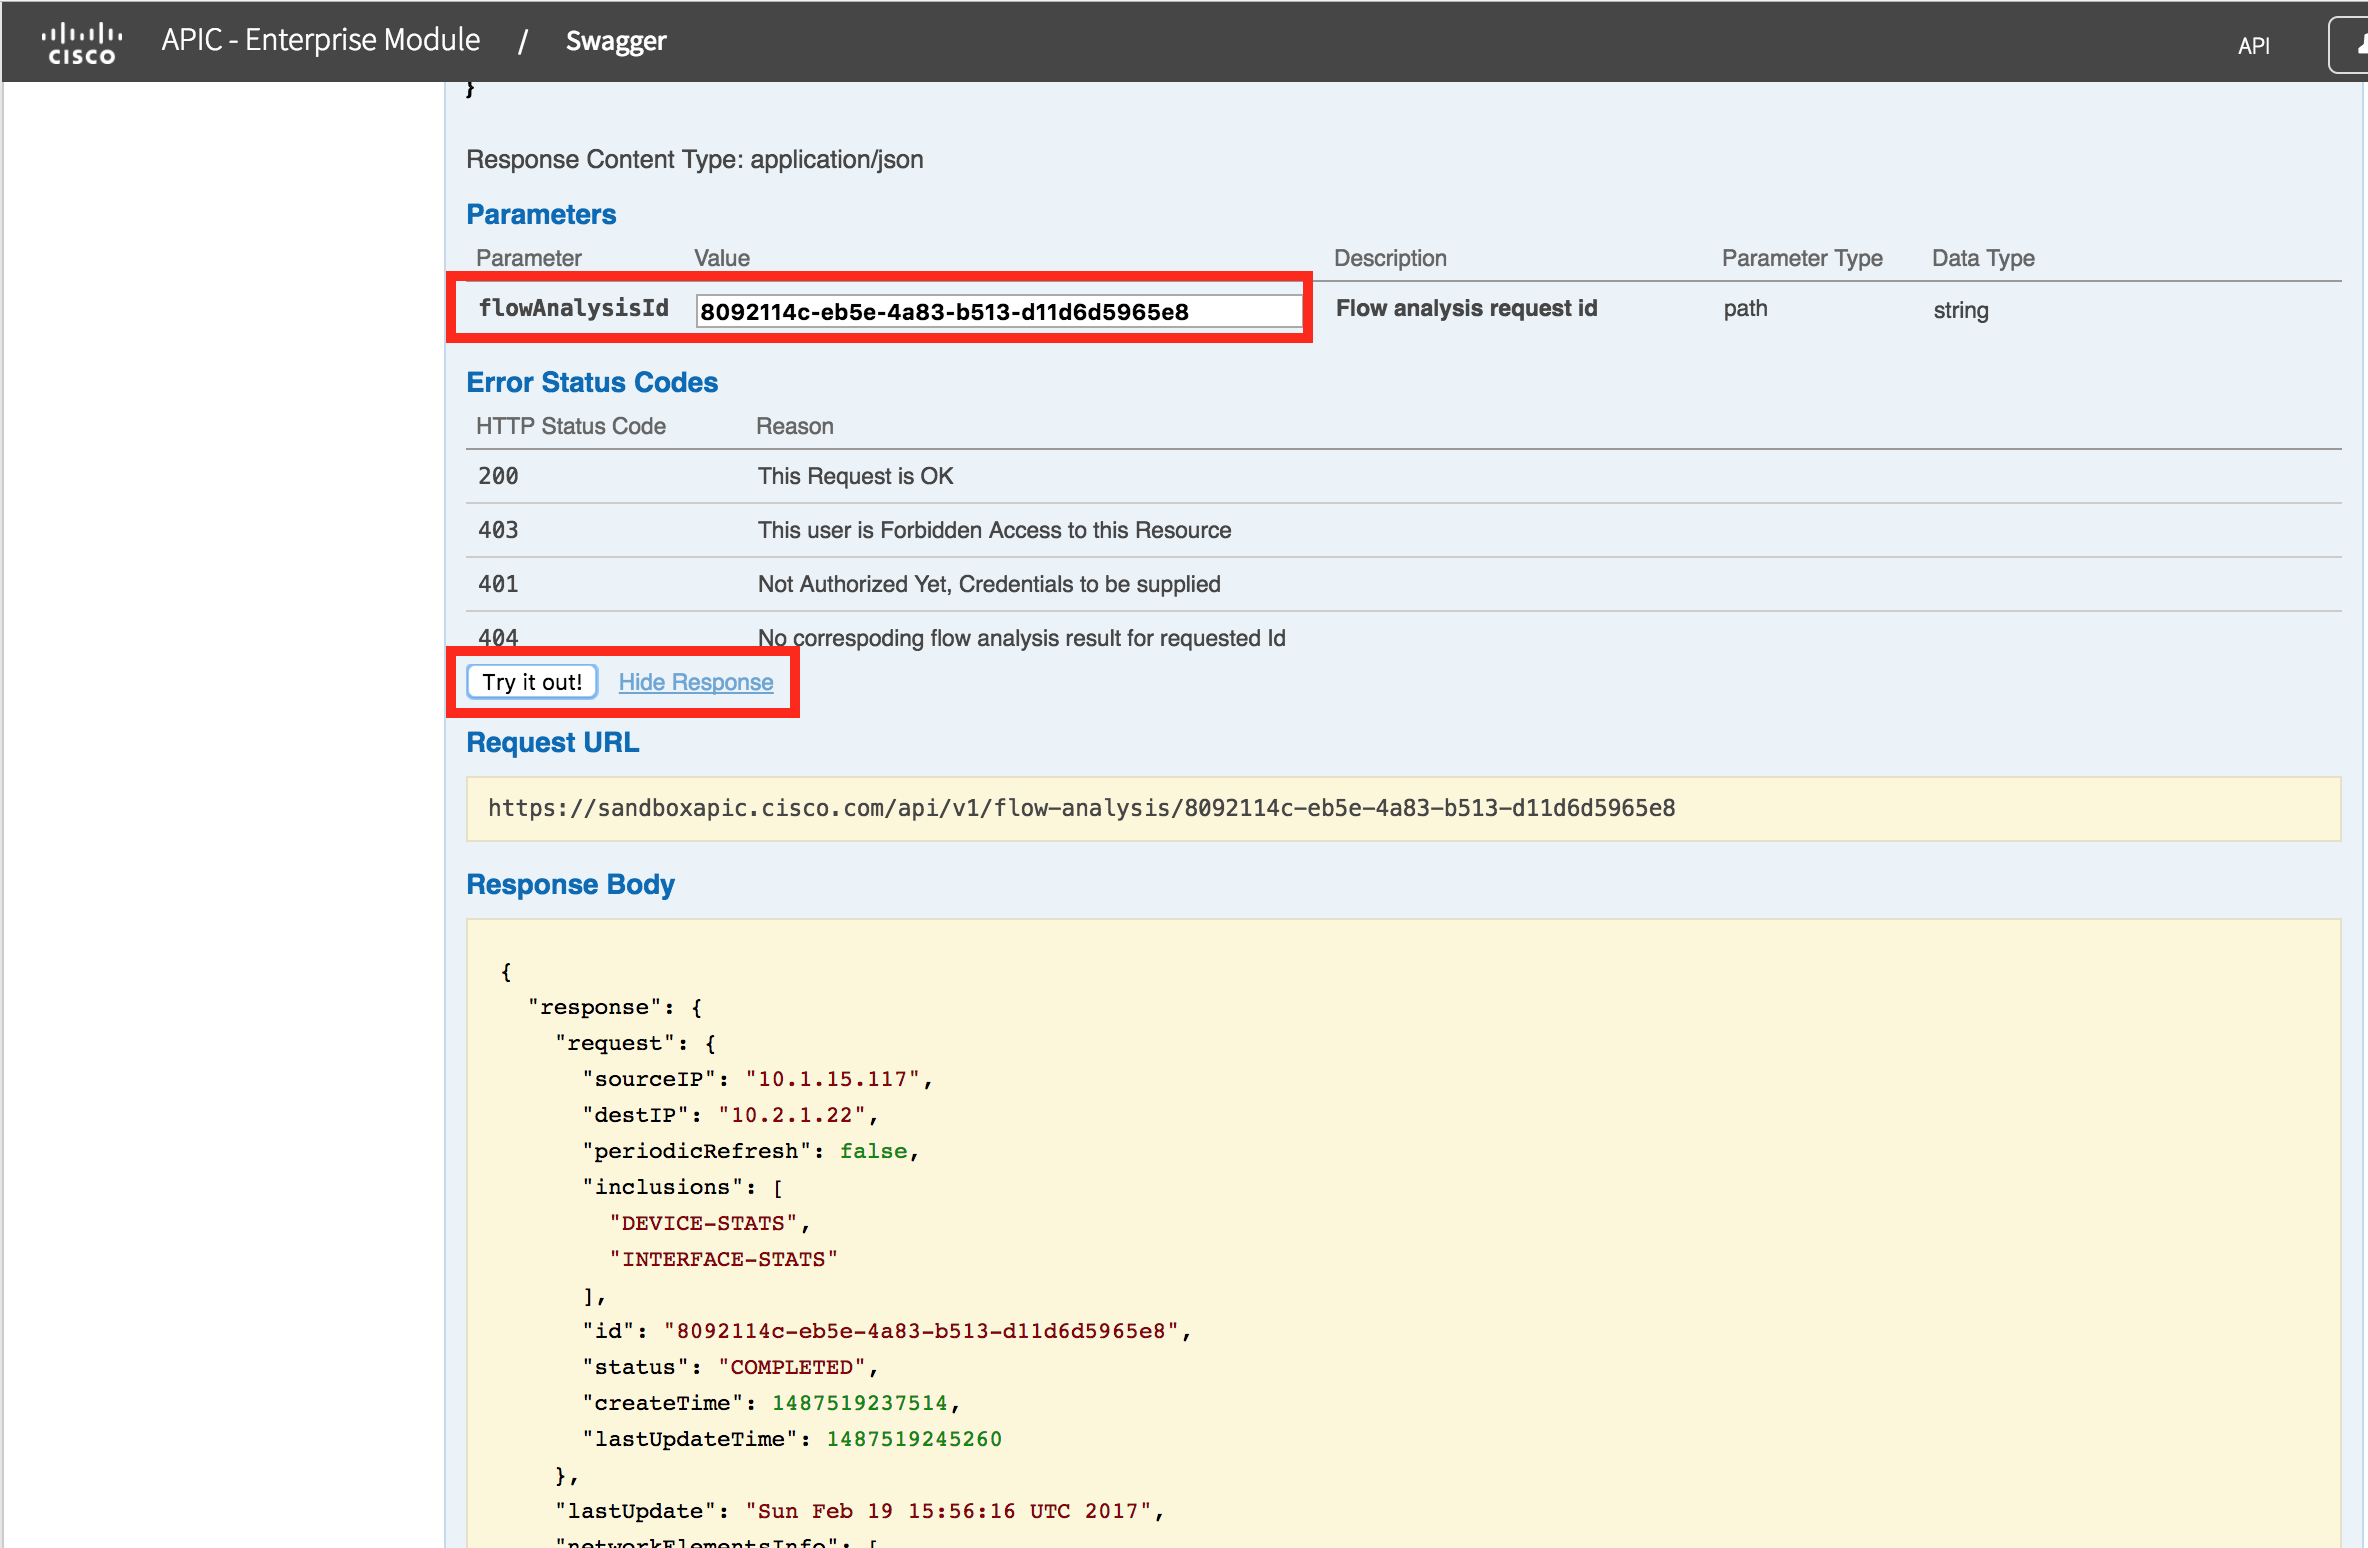
NOTE: You will notice that the flowAnalysisId returned by the task, is the same one that was returned by the initial POST in step #1. You are probably asking "Why not just poll the flowAnalysisId"? You are correct, you could do that in this case. The reason for showing you is, this is the general pattern that POST/PUT/DELETE calls use on APIC-EM. It is good to understand how it works for other use cases.
Script
All of these steps can be automated in a script.
The script 05_path_trace.py requires two arguments at a minimum. The source and destination IP address of the hosts. NOTE: these can also be addresses of interfaces on network-devices as well. It is optional to supply source and destination ports as well as ask for statistics (--stats)
|
./05_path_trace.py --srcip 10.1.15.117 --dstip 10.2.1.22 --stats
{"destIP": "10.2.1.22", "inclusions": ["INTERFACE-STATS", "DEVICE-STATS"], "sourceIP": "10.1.15.117", "periodicRefresh": false}
Waiting for Task db190241-ed5b-4868-9be6-d8ec70c6cc24
Task=db190241-ed5b-4868-9be6-d8ec70c6cc24 has not completed yet. Sleeping 2 seconds...
Task=db190241-ed5b-4868-9be6-d8ec70c6cc24 has not completed yet. Sleeping 2 seconds...
Task=db190241-ed5b-4868-9be6-d8ec70c6cc24 has not completed yet. Sleeping 2 seconds...
https://sandboxapic.cisco.com/api/v1/flow-analysis/63f53ca1-06f3-4d09-bd7a-2e9bcd006659
{
"detailedStatus": {
"aclTraceCalculation": "SUCCESS"
},
"lastUpdate": "Sun Feb 19 15:14:27 UTC 2017",
"networkElementsInfo": [
{
"ip": "10.1.15.117",
"type": "wireless",
"id": "48cdeb9b-b412-491e-a80c-7ec5bbe98167",
"linkInformationSource": "Switched"
},
{
"name": "AP7081.059f.19ca",
"ip": "10.1.14.3",
"role": "ACCESS",
"linkInformationSource": "Switched",
"type": "Unified AP",
"id": "cd6d9b24-839b-4d58-adfe-3fdf781e1782",
"tunnels": [
"CAPWAP Tunnel"
]
},
{
<SNIPPED> |
The output is quite verbose, as it shows the complete JSON payload as well as a summary. This shows the summary section
|
./05_path_trace.py --srcip 10.1.15.117 --dstip 10.2.1.22 --stats
{"destIP": "10.2.1.22", "inclusions": ["INTERFACE-STATS", "DEVICE-STATS"], "sourceIP": "10.1.15.117", "periodicRefresh": false}
Waiting for Task db190241-ed5b-4868-9be6-d8ec70c6cc24
Task=db190241-ed5b-4868-9be6-d8ec70c6cc24 has not completed yet. Sleeping 2 seconds...
Task=db190241-ed5b-4868-9be6-d8ec70c6cc24 has not completed yet. Sleeping 2 seconds...
Task=db190241-ed5b-4868-9be6-d8ec70c6cc24 has not completed yet. Sleeping 2 seconds...
<SNIPPED>
- 10.1.15.117:wireless
AP7081.059f.19ca:10.1.14.3 Switched
GigabitEthernet1/0/26
CAMPUS-Access1:10.1.12.1 Switched
GigabitEthernet1/0/1
GigabitEthernet5/5
CAMPUS-Dist1:10.255.1.5 Switched
GigabitEthernet5/38
GigabitEthernet0/0/1
Campus-WLC-5508:10.1.14.2 Switched
GigabitEthernet0/0/1
GigabitEthernet5/38
CAMPUS-Dist1:10.255.1.5 ECMP
TenGigabitEthernet3/1
TenGigabitEthernet1/5
CAMPUS-Core2:10.1.10.1 ECMP
GigabitEthernet1/3
GigabitEthernet0/0/1
CAMPUS-Router2:10.1.4.2 OSPF
GigabitEthernet0/0/3
UNKNOWN:UNKNOWN NetFlow
GigabitEthernet0/2
Branch-Router2:10.2.2.2 CONNECTED
GigabitEthernet0/2
GigabitEthernet1/0/1
Branch-Access1:10.2.1.17 Switched
GigabitEthernet1/0/47
10.2.1.22:wired
|
Looking at the code
There are three API calls used in this code.
- 1) "/flow-analysis" - a POST API call with a payload containing source and destination IP addresses (at a minimum). Returns a taskId used in the following step.
- 2) "/task/<taskId>" GET - All POST/PUT/DELETE API calls are asynchronous, meaning that you are given a taskId when you perform these operations, and you need to poll the taskId to find out what happened (and if the task is complete). The "progress" attribute will contain the UUID of the resource that has been created (a flowAnalysisId) of the path-trace response.
- 3) "/flow-analysis/<flowAnalysisId>" GET - returns the path-trace information. The flowAnalysisId is stored in the "progress" attribute of the task.
As in blog #4, the "argparse" library is used to parse the command line options.
The main work is done in the following function. Not the function post_and_wait, really just waits for the task to complete. The post_and_wait function polls /task to make sure the task has complete. In the example above, it was polled a total of 4 times, 2 seconds apart.
|
def create_path_trace(args):
data = {
"sourceIP" : args.srcip,
"destIP" : args.dstip,
"periodicRefresh" : False
}
if args.srcport is not None:
data["sourcePort"] = args.srcport
if args.dstport is not None:
data["destPort"] = args.dstport
if args.stats:
data["inclusions"] = ["INTERFACE-STATS","DEVICE-STATS"]
print(json.dumps(data))
result = post_and_wait("flow-analysis", data)
return result['progress']
|
The next step is to print it out. There are lots of options here in terms of formatting, I have just dumped the raw JSON, as well as attempted to pretty print a little.
|
def display_path(pathid):
path_data = get_url("flow-analysis/%s" % pathid)['response']
print(json.dumps(path_data,indent=2))
for network_element in path_data['networkElementsInfo']:
element_type = None
if 'type' in network_element:
element_type = network_element['type']
<SNIPPED>
|
What Next?
This is the final blog in the series. This blog covered /flow-analysis, an API to do a path trace between hosts on the network. /flow-analysis also provides stats on interfaces, QoS, Perfmon and ACL trace.
Take a look at my blog index for other related topics. https://communities.cisco.com/people/aradford/blog/2016/11
In the meantime, if you would like to learn more about APIC-EM, you could visit Cisco Devnet. All of the code samples can be found in this Github repository.
Thanks for reading
@adamradford123