- Cisco Community
- Technology and Support
- Networking
- Routing
- The sites connect via
- Subscribe to RSS Feed
- Mark Topic as New
- Mark Topic as Read
- Float this Topic for Current User
- Bookmark
- Subscribe
- Mute
- Printer Friendly Page
Internet connection freezes
- Mark as New
- Bookmark
- Subscribe
- Mute
- Subscribe to RSS Feed
- Permalink
- Report Inappropriate Content
02-23-2015 04:54 PM - edited 03-05-2019 12:52 AM
First, I want to thank you for reading my post.
I have a quite complex problem and I'm mostly looking for ideas on where to look. So far I haven't been able to pinpoint the problem anywhere.
We have a Cisco 6509 core that act as a colo for many sites. The sites hang via transport links from the colo. This switch seems to be having high CPU usage due to interrupts quite for a while. The CPU stays around 75%. But that is also a busy switch. I have been collecting the logs for a while and nothing stands out.
One of the sites has a cisco 3750 acting as a core, and then its Layer 2 HP procurve switches. NAT'in happens at the colo side, in a different device.
Users are reporting that their connection freezes. They do maintain their IP but are not able to do anything. It seems to be very random, but spread site wide.
I have looked at all the switches and only found two of them with spanning tree issues. The rest seem fine.
Noticed some spikes in the cpu usage for the cisco 3750, did an IOS upgrade, but that didn't help.
Checked the MTU size at both points and its set at 1500.
I'm very lost at this point, don't know where to look, and complaints keep coming.
Thank you in advance for all your suggestions.
-Ty
- Labels:
-
Other Routing
- Mark as New
- Bookmark
- Subscribe
- Mute
- Subscribe to RSS Feed
- Permalink
- Report Inappropriate Content
02-23-2015 05:04 PM
The CPU stays around 75%. But that is also a busy switch. I have been collecting the logs for a while and nothing stands out.
Post the complete output to the following commands:
1. sh version;
2. sh proc cpu sorted | ex 0.00
- Mark as New
- Bookmark
- Subscribe
- Mute
- Subscribe to RSS Feed
- Permalink
- Report Inappropriate Content
02-23-2015 05:13 PM
bs01.colo.ny#sh ver
Cisco IOS Software, s72033_rp Software (s72033_rp-IPSERVICESK9_WAN-M), Version 12.2(33)SXJ, RELEASE SOFTWARE (fc3)
Technical Support: http://www.cisco.com/techsupport
Copyright (c) 1986-2011 by Cisco Systems, Inc.
Compiled Thu 17-Mar-11 15:11 by prod_rel_team
ROM: System Bootstrap, Version 12.2(17r)SX7, RELEASE SOFTWARE (fc1)
bs01.colo.ny uptime is 3 years, 1 week, 2 days, 42 minutes
Uptime for this control processor is 3 years, 1 week, 1 day, 23 hours, 58 minutes
Time since bs01.colo.ny switched to active is 3 years, 1 week, 2 days, 2 minutes
System returned to ROM by reload at 19:24:31 EST Wed Feb 15 2012 (SP by reload)
System restarted at 20:08:08 EST Wed Feb 15 2012
System image file is "sup-bootflash:s72033-ipservicesk9_wan-mz.122-33.SXJ.bin"
Last reload reason: Reload Command
This product contains cryptographic features and is subject to United
States and local country laws governing import, export, transfer and
use. Delivery of Cisco cryptographic products does not imply
third-party authority to import, export, distribute or use encryption.
Importers, exporters, distributors and users are responsible for
compliance with U.S. and local country laws. By using this product you
agree to comply with applicable laws and regulations. If you are unable
to comply with U.S. and local laws, return this product immediately.
A summary of U.S. laws governing Cisco cryptographic products may be found at:
http://www.cisco.com/wwl/export/crypto/tool/stqrg.html
If you require further assistance please contact us by sending email to
export@cisco.com.
cisco WS-C6509-E (R7000) processor (revision 1.4) with 983008K/65536K bytes of memory.
Processor board ID SMG1151NLA0
SR71000 CPU at 600Mhz, Implementation 0x504, Rev 1.2, 512KB L2 Cache
Last reset from s/w reset
22 Virtual Ethernet interfaces
150 Gigabit Ethernet interfaces
52 Ten Gigabit Ethernet interfaces
1917K bytes of non-volatile configuration memory.
8192K bytes of packet buffer memory.
65536K bytes of Flash internal SIMM (Sector size 512K).
Configuration register is 0x2102
bs01.colo.ny#sh proc cpu sorted | ex 0.00
CPU utilization for five seconds: 86%/81%; one minute: 88%; five minutes: 80%
 PID Runtime(ms)   Invoked      uSecs   5Sec   1Min   5Min TTY Process
 265  11226830041098175944       1022  3.35%  3.08%  3.29%   0 IP Input
23 8850769721541480677 574 0.39% 0.92% 0.84% 0 IPC Seat Manager
288 20685643193669106 0 0.23% 0.20% 0.21% 0 Ethernet Msec Ti
518 564431792 910301837 620 0.15% 0.52% 0.54% 0 SNMP ENGINE
515 10615948 185812578 57 0.15% 0.13% 0.15% 0 IP NAT Ager
11 33920896 56414619 601 0.15% 0.09% 0.08% 0 ARP Input
460 998024 798509998 1 0.07% 0.03% 0.02% 0 PM Callback
357 26938120 47692760 564 0.07% 0.04% 0.05% 0 HIDDEN VLAN Proc
374 18734242901956479 0 0.07% 0.04% 0.05% 0 RADIUS
326 13068528 54612017 239 0.07% 0.02% 0.02% 0 IPC LC Message H
136 6007472 24964511 240 0.07% 0.05% 0.05% 0 CDP Protocol
50 8853696 95296986 92 0.07% 0.07% 0.07% 0 Per-Second Jobs
- Mark as New
- Bookmark
- Subscribe
- Mute
- Subscribe to RSS Feed
- Permalink
- Report Inappropriate Content
02-23-2015 05:26 PM
12.2(33)SXJ
Ok, you're using SXJ version 0.
uptime is 3 years, 1 week, 2 days, 42 minutes
Very high uptime. Good news and bad news.
CPU utilization for five seconds: 86%/81%; one minute: 88%; five minutes: 80% PID Runtime(ms) Invoked uSecs 5Sec 1Min 5Min TTY Process 265 11226830041098175944 1022 3.35% 3.08% 3.29% 0 IP Input
CPU is indeed high but the highest process is "IP Input" and only at ~3%.
Ok, this tells me the IOS could potentially have a bug in regards to memory/process allocation error. This means un-used process is NOT being returned back to the pool in a timely manner.
Get Cisco TAC to analyze this. If so, I'd recommend you think about upgrading the IOS.
- Mark as New
- Bookmark
- Subscribe
- Mute
- Subscribe to RSS Feed
- Permalink
- Report Inappropriate Content
02-24-2015 02:45 AM
Hi Leo,
CPU utilization for five seconds: 86%/81%;
Can you please tell me what does the value 81 signify here? Does it mean that the switch is doing lot of processing switch and only 5% is being interrupt driven processing.
CF
- Mark as New
- Bookmark
- Subscribe
- Mute
- Subscribe to RSS Feed
- Permalink
- Report Inappropriate Content
02-24-2015 01:04 PM
Can you please tell me what does the value 81 signify here? Does it mean that the switch is doing lot of processing switch and only 5% is being interrupt driven processing.
That value is the average CPU in a 5-second interval.
The sum of the processes running and the value in the average table do not match. This leads me to believe that there are un-used CPU processes (and probably memory) the OS have trouble returning back to the pool.
- Mark as New
- Bookmark
- Subscribe
- Mute
- Subscribe to RSS Feed
- Permalink
- Report Inappropriate Content
02-25-2015 08:05 AM
Thank you for answers Leo. From my research, the 81% is supposed to be due to interrupts.
I did a netdr debug and saw the traffic is directed to 5/R which refers to RP CPU on the supervisor engine in slot 5. And all looked like normal traffic.
I do think the switch is due an upgrade and a reboot. Was trying to see if I could spot something unusual also.
-Ty
- Mark as New
- Bookmark
- Subscribe
- Mute
- Subscribe to RSS Feed
- Permalink
- Report Inappropriate Content
02-25-2015 08:12 AM
Can you please share the output of netdr command?
CF
- Mark as New
- Bookmark
- Subscribe
- Mute
- Subscribe to RSS Feed
- Permalink
- Report Inappropriate Content
03-03-2015 07:56 AM
Sorry for the late reply, its been a busy week.
The freezing connection is resolved. Had to do some tweaking in the NAT'ing device, the users were running of ports. But the remote site is experiencing some ping loss, its not much, 2%, but there seems to be a pattern. This is the output of netdr capture.

- Mark as New
- Bookmark
- Subscribe
- Mute
- Subscribe to RSS Feed
- Permalink
- Report Inappropriate Content
03-03-2015 08:42 AM
Is it still just the one site where users are experiencing issues ?
If it is again that doesn't suggest the issue is with the 6500 specifically unless they are accounting for a lot of the traffic being sent to the RP.
Have you checked the link in use between that site and the 6500 site ?
I suggested quite a few things to look at in my last post in terms of narrowing down where the performance issue might be.
Concentrating on the 6500 may well be a waste of time if it is just one site is having problems.
Jon
- Mark as New
- Bookmark
- Subscribe
- Mute
- Subscribe to RSS Feed
- Permalink
- Report Inappropriate Content
03-03-2015 09:02 AM
There are two sites where its being reported, it was one site before and I concentrated a lot on that site. Checked the core switch, there were a few spikes there due to an IOS bug and upgraded the IOS. Checked all the switches for spanning tree changes, and there weren't any. Checked the links for errors, no errors. Checked if the link its being max'ed out, its not. Its a 10G handoff, and bandwidth offered is 1G.
They are reporting lags during streaming and gaming, which I realize it will always have lags. But I do see ping loss and ping latency in our NMS, and there's a pattern to it. It does happen during the peak times, which would mean the 6509 is working harder.
I understand the problem might not be on the 6500, but by fixing one issue at a time, I eliminate culprits.
- Ty
- Mark as New
- Bookmark
- Subscribe
- Mute
- Subscribe to RSS Feed
- Permalink
- Report Inappropriate Content
03-03-2015 09:18 AM
Okay, are the sites connecting directly into the 6500 ?
If so what do the interfaces show in terms of packet drops etc.
Same for the remote end.
Do you have any QOS in your network because streaming may well be affected by other packets and there may well be congestion within your network.
Jon
- Mark as New
- Bookmark
- Subscribe
- Mute
- Subscribe to RSS Feed
- Permalink
- Report Inappropriate Content
03-03-2015 10:29 AM
The sites connect via transport links. They connect to an NNI and that connects to the 6509. So I cannot see the entry point specific for a site but there is packet loss, and it seems to follow the same pattern.
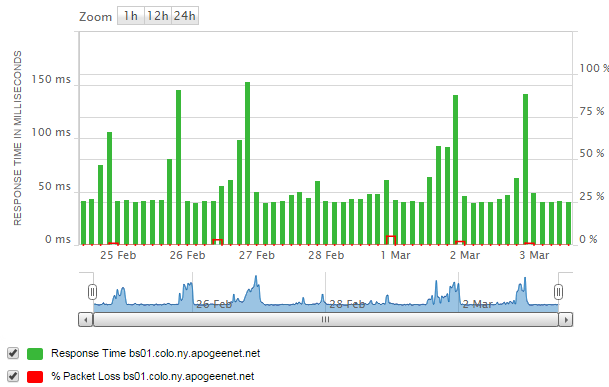
The same pattern is in the sites that connect from it, some more, some less though
I will request a maintenance to upgrade the 6509 and go from there.
-Ty
- Mark as New
- Bookmark
- Subscribe
- Mute
- Subscribe to RSS Feed
- Permalink
- Report Inappropriate Content
02-26-2015 10:02 AM
If it is normal traffic it shouldn't be sent to the RP, it should be hardware switched.
I'm not sure the issue is with either the IOS or the uptime to be honest although it could be.
There is, as you say, a lot of interrupt switching and that is certainly worth looking into but from your initial description the issue is at one remote site.
If the 6500 was the main cause then i would expect all sites to be showing performance issues.
What tests have you run at the remote site ?
When the users complain of not being able to do anything have you tried to do basic pings/traceroutes between the sites to see if there is connectivity ?
What are the users trying to do in terms of access ie. where are the servers, are they with the 6500 or are they local ?
What type of connectivity is there between the sites and the 6500 location and where does NAT come into it ?
You mention internet connectivity, is this how they connect back to your central site or is it that internet connectivity is provided centrally ?
There could be a whole host of reasons and it is possible the 6500 is one of them but if it is just a specific site i would start looking there first.
Perhaps if you could fill in the blanks we could suggest where to start looking.
Jon
Discover and save your favorite ideas. Come back to expert answers, step-by-step guides, recent topics, and more.
New here? Get started with these tips. How to use Community New member guide