- Cisco Community
- Technology and Support
- Networking
- Routing
- Traffic Shaping and LLQ... weird behavior (is it normal?)
- Subscribe to RSS Feed
- Mark Topic as New
- Mark Topic as Read
- Float this Topic for Current User
- Bookmark
- Subscribe
- Mute
- Printer Friendly Page
Traffic Shaping and LLQ... weird behavior (is it normal?)
- Mark as New
- Bookmark
- Subscribe
- Mute
- Subscribe to RSS Feed
- Permalink
- Report Inappropriate Content
12-08-2013 11:34 AM - edited 03-04-2019 09:48 PM
I have a problem with LLQ and the router letting go through itself more traffic than it should be allowed too, so my queues seem not to be applying the exact BW limitations i have configured…
I think it has to be with the router generating 670Kbps aprox INSTEAD of the 512Kbps it should be generating for the parent policy (SHAPING512), WHY ON EARTH is allowing more traffic… I understand the priority queue IS WORKING cuz is actually policing to the limit established (384Kbps) but because the router is letting go through itself more bits than what it should I see all my other queues going above of what they should!!!!
Omg I have been trying to figure this out a lot of hours (a LOT hahaha) so… if someone could help me out here it would be sooooooooo great!!!
NOTES:
I am using for my lab 1861x2 with c1861-adventerprisek9-mz.151-3.T4.bin servers are win7 boxes and the unknown traffic is iperf...
for some reason the max-reserved-bandwidth command wasnt necessary, the interface dont recognize the command nor gave the error when reserving more than a threshold ...
if you need any other information to help just ask !
Thanks in advance!!!!
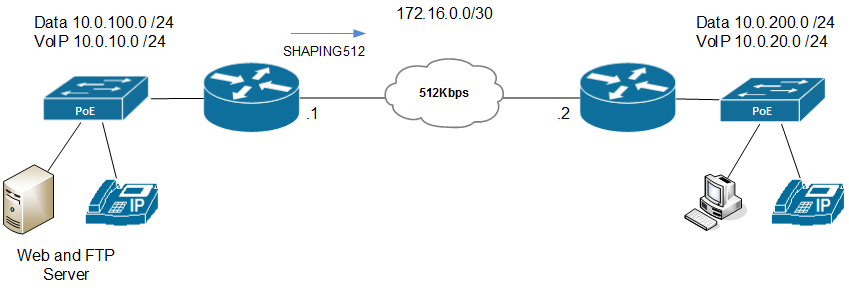
My policy is being applied on my server side where the traffic is generating outbound (where SHAPE512 should be establishing the limit for my outbounf traffic):
Output obtained of a “show policy-map”
Policy Map SHAPE512
Class class-default
Average Rate Traffic Shaping
cir 512000 (bps)
service-policy PRIORITY
Policy Map PRIORITY
Class HTTP
priority 75 (%)
Class FTP
bandwidth 20 (%)
Class class-default
fair-queue
packet-based wred, exponential weight 9
class min-threshold max-threshold mark-probablity
----------------------------------------------------------
0 - - 1/10
1 - - 1/10
2 - - 1/10
3 - - 1/10
4 - - 1/10
5 - - 1/10
6 - - 1/10
7 - - 1/10
I am applying the policy on my WAN interface from the server side where traffic is being generating in an outbound direction…
interface FastEthernet0/0
description WAN
bandwidth 512
ip address 172.16.0.1 255.255.255.252
ip nbar protocol-discovery
load-interval 60
duplex auto
speed auto
service-policy output SHAPE512
end
Then when trying to check the policy with the “show policy-map interface” command it seems like if it was working just fine:
FastEthernet0/0
Service-policy output: SHAPE512
Class-map: class-default (match-any)
624700 packets, 260135526 bytes
1 minute offered rate 671000 bps, drop rate 158000 bps
Match: any
Queueing
queue limit 64 packets
(queue depth/total drops/no-buffer drops) 26/40745/0
(pkts output/bytes output) 584009/210207402
shape (average) cir 512000, bc 2048, be 2048
target shape rate 512000
Service-policy : PRIORITY
queue stats for all priority classes:
queue limit 64 packets
(queue depth/total drops/no-buffer drops) 0/0/0
(pkts output/bytes output) 70320/88516627
Class-map: HTTP (match-all)
109401 packets, 138343257 bytes
1 minute offered rate 386000 bps, drop rate 158000 bps
Match: protocol http
Priority: 75% (384 kbps), burst bytes 9600, b/w exceed drops: 39081
Class-map: FTP (match-all)
65230 packets, 92533763 bytes
1 minute offered rate 227000 bps, drop rate 0 bps
Match: protocol ftp
Queueing
queue limit 64 packets
(queue depth/total drops/no-buffer drops) 2/4/0
(pkts output/bytes output) 65137/92401765
bandwidth 20% (102 kbps)
Class-map: class-default (match-any)
450069 packets, 29258506 bytes
1 minute offered rate 56000 bps, drop rate 0 bps
Match: any
Queueing
queue limit 64 packets
(queue depth/total drops/no-buffer drops/flowdrops) 22/1660/0/0
(pkts output/bytes output) 448552/29289010
Fair-queue: per-flow queue limit 16
Exp-weight-constant: 9 (1/512)
Mean queue depth: 10 packets
class Transmitted Random drop Tail/Flow drop Minimum Maximum Mark
pkts/bytes pkts/bytes pkts/bytes thresh thresh prob
0 438377/28532748 250/13584 123/6666 20 40 1/10
1 0/0 0/0 0/0 22 40 1/10
2 0/0 0/0 0/0 24 40 1/10
3 63/7838 0/0 1/154 26 40 1/10
4 0/0 0/0 0/0 28 40 1/10
5 9300/688200 108/7992 169/12506 30 40 1/10
6 812/60224 0/0 0/0 32 40 1/10
7 0/0 0/0 0/0 34 40 1/10
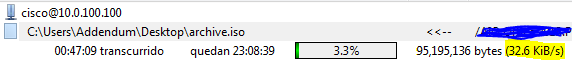
But what it’s so so so confusing is that even those statistics seems to be fine, the downloads from the client side tell another story!!!! the FTP traffic is pretty solid on being above HTTP or being just at the same rate as HTTP…
FTP Transfer
HTTP Transfer

Confirmed by NBAR rates, that at some moments http go less than that and ftp goes a little up…
FastEthernet0/0
Last clearing of "show ip nbar protocol-discovery" counters 03:28:17
Input Output
----- ------
Protocol 1min Bit Rate (bps) 1min Bit Rate (bps)
------------------------ ------------------------ ------------------------
http 9000 377000
ftp 4000 228000
rtp 0 0
eigrp 0 0
edonkey 0 0
rtcp 0 0
h323 0 0
icmp 0 0
unknown 3335000 57000
Total 3348000 662000
WHY ON EARTH THE TOTAL SUM OF BITS per second is 670Kbps aprox D: !!!! that rate is pretty solid and actually can be confirmed by the statistics on the client machine
Any help or idea would be greatly appreciated!!!!
- Labels:
-
Other Routing
Discover and save your favorite ideas. Come back to expert answers, step-by-step guides, recent topics, and more.
New here? Get started with these tips. How to use Community New member guide
