- Cisco Community
- Technology and Support
- Service Providers
- Service Providers Knowledge Base
- ASR9000/XR Netflow Architecture and overview
- Subscribe to RSS Feed
- Mark as New
- Mark as Read
- Bookmark
- Subscribe
- Printer Friendly Page
- Report Inappropriate Content
- Subscribe to RSS Feed
- Mark as New
- Mark as Read
- Bookmark
- Subscribe
- Printer Friendly Page
- Report Inappropriate Content
on 09-26-2012 12:06 PM
- Introduction
- Basic configuration for netflow
- Scale parameters for netflow
- Netflow support
- Architecture
- Netflow Cache size, maintenance and memory
- Sample usage
- Cache Size
- Aging
- Which packets are netflowed?
- Sampling
- Monitoring netflow
- The exporter (MAP)
- Troubleshooting Netflow
- Exporter fields
- Not supported features
- Related Information
Introduction
This document decribes the ASR9000 netflow architecture.
It provides a basic configuration how to set up netflow and what the parameters are for scale and how netflow is implemented in the ASR9000/XR
Basic configuration for netflow
The basic configuration for netflow consists of an
Flow monitor map
An exporter map
and a sampler map.
The Flow monitor MAP pulls in the Exporter map
On the interface you want to enable netflow on, you pull in the monitor map and the sampler map.
flow monitor-map FM
record ipv4
exporter FE
cache permanent
cache entries 10000
! cache timeouts define how frequently we export what, max of 1M per LC
cache timeout active 2
cache timeout inactive 2
!
flow exporter-map FE
version v9
options interface-table timeout 120
! these 2 define the exports of the sample map and interface table to theflow collector for sync'ing indexes
! to names etc.
options sampler-table timeout 120
!
transport udp 1963
destination 12.24.39.1
source <interfacename>
!
sampler-map FS
random 1 out-of 1
interface GigabitEthernet0/0/0/20
description Test PW to Adtech G4
ipv4 address 16.1.2.1 255.255.255.0
flow ipv4 monitor FM sampler FS ingress
!
Scale parameters for netflow
Ø    Trident: 100kpps/LC (total, that is in+out combined)
       Typhoon: 200kpps/LC
Ø   1M records per LC  (default cache size is 64k)
Ø   50K Flows per sec export per LC
Ø   Sample intervals from 1:1 to 1:64k
Ø Up to 8 exporters per map, vrf aware
Netflow support
Architecture
Netflow is not hardware accelerated in the ASR9000 or XR for that matter, but it is distributed.
What that means is that each linecard individually runs netflow by itself.
Resources are shared between the interfaces and NPU's on the linecard.
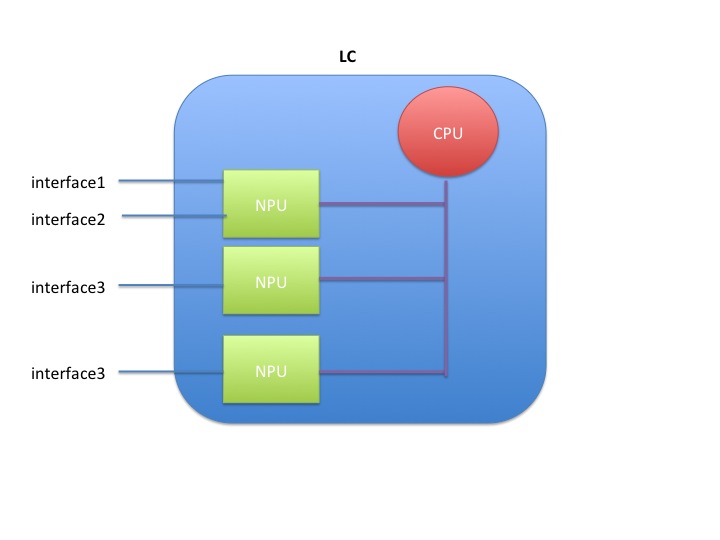
When you have 1 interface to one NPU on one linecard enabled for netflow, the full rate is available to that interface, which is 100k pps for trident and 200k for typhoon.
When you enable 2 interfaces on the same NPU on the same LC, then both interfaces share the 100k pps (trident) or 200k pps (typhoon)
When you enable 2 interfaces on 2 different NPU's, then both NPU's share the total rate of 100k/200k amongst them giving each NPU 50k or 100k depending on the LC type.
Packet flow for netflow
Inside the LC CPU

Netflow Cache size, maintenance and memory
In IOS-XR platforms, it is the LC processor memory that holds the netflow cache.
NetFlow Cache is a Section of memory that stores flow entries before they are exported to external collector.
The ‘nfsvr’ process running on the linecard, manages the netflow cache.
Memory usage
The memory used can be monitored via this command:
show flow monitor FM cache internal location 0/0/CPU0
...
Memory used: 8127060
Total memory used can be verified by checking the process memory util of "NFSVR"
show processes memory location 0/0/CPU0 | inc nfsvr
257 139264 65536 73728 12812288 nfsvr
Sample usage
The memory used with the cache size of default 64k entries for ipv4 & MPLS is about 8MB & for ipv6 is about 11MB.
The memory used with the cache size of maximum 1M entries for ipv4 & MPLS is about 116 MB & for ipv6 is about 150MB.
The memory used with cache size of maximum 1M entries (default is 65535) is about 116 MB per ipv4 flow monitor .
If ‘n’ ipv4 flow monitors are used all with maximum 1M entries, the memory used would be n x 116 MB.
Cache Size
Configuration to set the cache entries to ten thousand looks as follows:
flow monitor-map FM
cache entries 10000
Aging
95% of configured cache size is the high watermark threshold. Once this threshold is reached, certain flows (longest idle ones etc) are aggressively
timed out. XR 4.1.1 attempts to expire 15% of the flows.
The show flow monitor FM cache internal location 0/0/cpu0 command will give you the data on that:
Cache summary for Flow Monitor :
Cache size: 65535
Current entries: 17
High Watermark: 62258
NETFLOW-6-INFO_CACHE_SIZE_EXCEEDED
this syslog message means that we wanted to add more entries to the cache than what it could hold. There are a few different reasons and remediations for it:
- the cache size is too small, and by enlarging it we can hold more entries
- the inactive timeouts are too long, that is we hold entries too long in the cache not getting aged fast enough
- we have the right size cache, and we do export them adequately, but we are not getting the records out fast enough due to volume, in that case we can tune the rate limit of cache expiration entries via:
flow monitor <name> cache timeout rate-limit <time>
Permanent cache
The permanent cache is very different from a normal cache and will be useful for accounting or security monitoring. The permanent cache will be a fixed size chosen by the user. After the permanent cache is full all new flows will be dropped but all flows in the cache will be continuously updated over time (i.e similar to interface counters).
Note that the permanent cache uses a different template when it comes to the bytes and packets.
When using this perm cache, we do not report fields 1 and 2, but instead use 85 and 86.
Fields 1 and 2 are “deltas” 85 and 86 are "running counters".
In your collector you need to "teach" it that 1 and 85, 2 and 86 are equivalent.
Characteristics
Which packets are netflowed?
All packets subject to sampling, regardless or whethe they are forwarded or not are subject to netflow.
This includes packets dropped by ACL or QOS policing for instance!
A drop reason is reported to NF..
* ACL deny
* unroutable
* policer drop
* WRED drop
* Bad IP header checksum
* TTL exceeded
* Bad total length
* uRPF drop
Example
IPV4SrcAddr      IPV4DstAddr      L4SrcPort  L4DestPort IPV4Prot IPV4TOS InputInterface  ForwardStatus        ByteCount    PacketCount  Dir

17.1.1.2         99.99.99.99      3357       3357       udp      0     Gi0/1/0/39      DropACLDeny          415396224    8654088      Ing
Sampling
As described in the architecture section, the total sampling capability depends on the number of interfaces having netflow enabled.
It shaped up to be something like this table:
|
# of NPs Enabled for Netflow |
Policing Rate Per Trident NP (Unidirectional) |
Policing Rate Per Typhoon NP (Unidirectional) |
|
1 |
100kpps |
200kpps |
|
2 |
50kpps |
100kpps |
|
3 |
33kpps |
66kpps |
|
4 |
25kpps |
50kpps |
Punt Policing of netflow packets
All packets that exceed this rate are dropped by the punt policer.
You can verify that by the controllers np counters command.
show controllers np counters all
Node: 0/0/CPU0:
----------------------------------------------------------------
Show global stats counters for NP0, revision v2
Read 67 non-zero NP counters:
Offset Counter FrameValue Rate (pps)
-------------------------------------------------------------------------------
....
934 PUNT_NETFLOW 18089731973 6247
935 PUNT_NETFLOW_EXCD 6245 0
...
The _EXCD depicts that the police rate had been exceeded.
This means that you likely have to increase your sampling interval.
Monitoring netflow
sh flow monitor FM cache format table include layer4 tcp-flags ipv4 sour dest prot tos count pack byte location 0/0/CPU0
Mon Apr 19 09:31:19.589 EDT
Cache summary for Flow Monitor FM:
Cache size: 10000
Current entries: 1
High Watermark: 9500
Flows added: 1
Flows not added: 0
Ager Polls: 580
- Active timeout 0
- Inactive timeout 0
- TCP FIN flag 0
- Watermark aged 0
- Emergency aged 0
- Counter wrap aged 0
- Total 0
Periodic export:
- Counter wrap 0
- TCP FIN flag 0
Flows exported 0
IPV4SrcAddr IPV4DstAddr IPV4Prot IPV4TOS L4TCPFlags ByteCount PacketCount
16.1.2.2 16.1.1.2 tcp 0 S| 4282560 71 376
Matching entries: 1
The exporter (MAP)
Export occurs when data in the cache is removed which can occur in one of three ways.
- Inactive timer expiry : The cache entry expires due to not matching an incoming packet for a specified amount of time. Default value is 15 seconds.
- Active timer expiry : The cache entry, though still matching incoming packets, has been in the cache so long that it exceeds active timer. Default value is 30 minutes
- Cache Exhaustion : The cache becomes full, so some of the oldest entries are purged to make room for new entries.
The netflow exporter can be in a VRF, but can not be out of the Mgmt Interface.
Here’s why. The netflow runs off of the line card (LC interfaces and NP) and there is, by default, no forwarding between the LCs and the management Ethernet.

This because the MGMT ether is designated out of band by LPTS (local packet
transport services). More detail in the ASR9000 Local packet transport services
document here on support forums).
Netflow records can be exported to any destination that may or may not be local to the LC where netflow is running. For example, LC in slot 1 & 2 are running netflow & the exporter may be connected to an interface reachble via LC in slot 3.
A total of 8 exporters per MAP is allowed.
Troubleshooting Netflow
Tue Nov 16 11:23:41.437 EST
Flow Exporter: FE
Flow Exporter memory usage: 3280812
Used by flow monitors: FM
Transport UDP
Destination 3.0.0.38 (1963)
Source 0.0.0.0 (12162) <<<<<<< PROBLEM!!
Flows exported: 0 (0 bytes)
Flows dropped: 0 (0 bytes)
.....
Exporter fields
Flow record key fields
- IPv4 source & destination addresses
- IPv4 protocol & TOS byte
- Transport source & destination ports
- Input interface
- Direction
- Forwarding status
- BGP next-hop
Flow record non-key fields
- TCP flags
- IPv4 source & destination prefix mask length
- Source & destination BGP AS #
- IPv4 address of BGP next hop
- Packet & byte counters
- First & last packet timestamps
- Output interface
Not supported features
Ø DBNA
Ø Cisco netflow mib is not supported.
Related Information
Netflow cache size considerations
Recent enhancements
Show commands
show flow exporter-map ..
show flow monitor-map ..
show sampler-map ..
show processes memory location <0/0/CPU0> | inc nfsvr
show flow monitor .. cache internal location <0/0/CPU0>
show flow exporter .. location <0/1/CPU0>
show flow platform producer statistics location <0/0/CPU0>
show flow platform nfea policer np <np_num> loc <node-id>
show controller np ports all location <0/Y/CPU0>
show controller np count np<number> loc <0/Y/CPU0>
- Mark as Read
- Mark as New
- Bookmark
- Permalink
- Report Inappropriate Content
hi garry, it doesnt look like it made it in xr60/61 will check what the plan of record is for the flexible netflow. I think it lost some traction because of the telemetry application that seems to get a lot more traction.
this is currently in development, some glitches to be gleaned out, once iti s a bit more solidified I'll make a write up on that also, as it seems very interesting.
cheers!
xander
- Mark as Read
- Mark as New
- Bookmark
- Permalink
- Report Inappropriate Content
Hi Xander! how are you!.. I d´appreciate if you could give some help
In next month we are going to intall 26 MOD-200-SE with 2x100G MPA. We will need to configured there as we have today,
flow mpls monitor
regarding this, today we have it in the uplinks interfaces
RP/0/RSP0/CPU0:BEL1MB#sho run int tenGigE 0/5/0/0
flow mpls monitor MPLS_UPLINK sampler FNF_SAMPLER_MAP ingress
where...
!
flow monitor-map MPLS_UPLINK
record mpls ipv4-ipv6-fields
exporter FNF_EXPORT_MAP
exporter EXPORT_MAP_Deepfield_1
cache entries 70000
cache timeout active 50
cache timeout rate-limit 500000
!
sampler-map FNF_SAMPLER_MAP
random 1 out-of 10000
!
Due to the newones are tomahawk technology , I need to know if Cisco will go on recommending a sampling of 1:10000 or it is possible forward to configure 1:1000. And in that case which are the recommendatios or suggestion for cache parameters.
Best refards!
Cheers!
Javier
- Mark as Read
- Mark as New
- Bookmark
- Permalink
- Report Inappropriate Content
hi javier! :) the TH cards like typhoon have a punt policer for netflow of 200kpps per LC.
since the mod 200 has one NPU, that 200kpps is available for that single NPU and aggregated over all the interfaces that the MOD runs.
So both 100G interfaces share that 200kpps.
Based on simple math: at 200kpps with 1500 byte packets we are at 2.2Gbps.
so with a sampling rate of 1 out of 1000 *and* a packet size of 1500 we could sustain 200G and that sampling rate.
Likely your av pak size is smaller than 1500, so we have to be higher then 1000.
sampling 1:10,000 generally gives you enough insight already. you can go lower, but if the pak size is too small, we may see more then 200k pps requested to be punted that lpts will prevent.
so focus on the NFLOW_EXCEED counter in lpts to see if you are hitting that max punt rate in case you go lower then 1:10,000.
cheers!!
xander
- Mark as Read
- Mark as New
- Bookmark
- Permalink
- Report Inappropriate Content
Hey Xander!! thank you!! you are faster than a hundredgig!
;-)
Cheers
javier
- Mark as Read
- Mark as New
- Bookmark
- Permalink
- Report Inappropriate Content
Hi Xander,
Agree that 1:10,000 is de facto standard, but with regards to the LPTS –can the netflow punt rate be lifted via configuration please?
Thank you
adam
netconsultings.com
::carrier-class solutions for the telecommunications industry::
- Mark as Read
- Mark as New
- Bookmark
- Permalink
- Report Inappropriate Content
ah yeah most policers are configurable, the netflow policer (along with some others) are hard coded. the netflow policer is a software setting that can't be overridden. I have a request open for that as I feel we can go higher, but no one has made it a serious request, so that is shelved. (subject to dev and test)xander
- Mark as Read
- Mark as New
- Bookmark
- Permalink
- Report Inappropriate Content
I see so this one is fixed, well yeah I don’t see a compelling reason why this policer should be configurable either, netflow is not a port mirror, so maybe preventing engineers from shooting themselves in the foot by enforcing the rate limit is the right thing.
adam
netconsultings.com
::carrier-class solutions for the telecommunications industry::
- Mark as Read
- Mark as New
- Bookmark
- Permalink
- Report Inappropriate Content
not yet integrated in any code, but the request is peding adam :).
true netflow is not port mirror, but some folks like lower more aggressive sampling rates to get better visibility. TH and its lc cpu can do much better then 200kpps/LC so technically it should be possible, one and other depending on the available pps on the npu and business of the lc cpu. that is a large qualification effort hence the reluctance going larger.
cheers!
xander
- Mark as Read
- Mark as New
- Bookmark
- Permalink
- Report Inappropriate Content
Intel IVY Bridge EN 6 cores @ ~2GHz with 3x 8Gig DIMMs, I bet it could do more than 200kpps :)
But I appreciate that actually copying the packets from the NPU, while not crippling it’s performance too much, has to be the hardest part indeed.
Thank you
adam
- Mark as Read
- Mark as New
- Bookmark
- Permalink
- Report Inappropriate Content
Hey! hi Xander how are you.... Could I add another question, we are noticing in syslog we have %PKT_INFRA-PQMON-6-QUEUE_DROP and the TAC recommended us to change the Netflix sampling ratio to 1:10000 because the queue XIPC was doing taildrop (maybe because of netflow).. so my question is, if it is possible to change the size of the XIPC queue, or better ignore this alarm message in spite of having a rate of 1:1000.
Best regards!
Javier
PD: TAC said:
Basically, this message "%PKT_INFRA-PQMON-6-QUEUE_DROP" means that sampling is too low and it is depleting XIPC due to the big amount of packets exported to NetFlow.
Now, speaking of the possible affectation/degradation created from these logs:
-No traffic will be affected AT ALL. Packet forwarding will forwarded normally as NetFlow is an independent operation from packet forwarding via CEF or CPU.
-The drops that we’re seeing simultaneously with these messages are on this particular queue for NetFlow export. NetFlow won’t be sampling 1 packet every 1000 as it will be dropping some as it doesn’t have enough space on the buffer. Basically, the only problem with this log is that we won’t be having a 1:1000 sampling.
For the next steps and to alleviate this problem, our recommendation is to lower the Sampling from 1:1000 to a larger value. On command reference, you can see the recommendation is a value of 1:10000.
- Mark as Read
- Mark as New
- Bookmark
- Permalink
- Report Inappropriate Content
Hello
hope you are doing good
Need Help
I am not sure if you will be seeing this but we are running into a strange problem on ASR9k we enabled netflow all the config seems proper exporter shows the cache is properly updated as no of packets processed increases but some how the netflow collector (maintained by tools team) seems not receivng the flows, the team says may be the router is not sending it after all , they claim this as the firewall in between dont see any netflow traffic (on a specific port) comming from my router towards netflow collector server, however ping and trace goes from router source to the netflow collector and are logged in the firewall , once we remove the config and add back firewall team says they see that some traffic passed and then it stopped after a while ..
we are using loop back in global table and the netflow collector route is also in global table but we have enabled the ingress and egress on 0/5/0/X which is in VRF INTERNET ..
any ideas what caused this netflow data not to be sent to collector even though the cache is showing properly and stats has no packet drops
- Mark as Read
- Mark as New
- Bookmark
- Permalink
- Report Inappropriate Content
Hi,
if the "Flows exported:" part is increasing then it should be going to the destination, i.e.
Does the FW support packet capture? If it's an ASA then you can capture the traffic with command "capture" and the show capture for destination and port
If you see the
- Mark as Read
- Mark as New
- Bookmark
- Permalink
- Report Inappropriate Content
also make sure that the export dest is reachable with the source configured from the a9k and ensure that it is not found via the mgmt interface.
look at show flow exporter-map stats to see what is going on from an export perspective also.
xander
- Mark as Read
- Mark as New
- Bookmark
- Permalink
- Report Inappropriate Content
Thank you both
Finally a relief we have been bothered by this many a times and found after a bit of luck that the ASA will not show the logs of the live netflow traffic it only shows once when the session is established with the flow server/collector and then there is nothing even though the data is received on the server .. I am still not sure why the server stops receiving abruptly while the router sends the data (may be server capacity issue only server guys can figure out) but it became clear that router has no issues what so ever and if this sort of issue happens again it will be on server/tools team... Cheers..
- Mark as Read
- Mark as New
- Bookmark
- Permalink
- Report Inappropriate Content
Hello I am wondering how to use this with the following configuration:
interface Bundle-Ether12.3481
 description --- TRANSPORT ---
 ipv4 point-to-point
 ipv4 unnumbered Loopback3401
 arp timeout 300
 proxy-arp
 lldp
 transmit disable
 !
 load-interval 30
 flow ipv4 monitor FNM-IPV4 sampler ONE_PER_HUNDRED ingress
 flow ipv4 monitor FNM-IPV4 sampler ONE_PER_HUNDRED egress
 encapsulation dot1q 3481
!
Will this configuration work on this interface?
Find answers to your questions by entering keywords or phrases in the Search bar above. New here? Use these resources to familiarize yourself with the community: