- Cisco Community
- Technology and Support
- Networking
- Switching
- 2821 High Interface Discards - RP Drops??
- Subscribe to RSS Feed
- Mark Topic as New
- Mark Topic as Read
- Float this Topic for Current User
- Bookmark
- Subscribe
- Mute
- Printer Friendly Page
2821 High Interface Discards - RP Drops??
- Mark as New
- Bookmark
- Subscribe
- Mute
- Subscribe to RSS Feed
- Permalink
- Report Inappropriate Content
04-08-2013 10:57 AM - edited 03-07-2019 12:42 PM
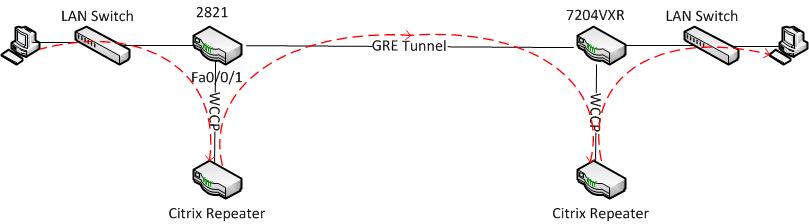
I am having an issue pinpointing why my 2821 router is discarding so many packets when transferring data to our second site. The traffic flows from the local lan, to the router, where it is redirected via WCCP to a WAN optimization device, back to the router and over a GRE tunnel to the second site where the same process happens. The traffic does get there, but the LAN/Repeater router interfaces have around 20,000-60,000 input drops an hour. From the output below, it looks like traffic is being dropped by the RP, but I'm not sure why.
I just restarted the router as a last resort, and here is what has accumulated in the last 30 min:
FastEthernet0/0/1 is up, line protocol is up
Hardware is Fast Ethernet, address is 0025.840c.7680 (bia 0025.840c.7680)
Description: REPEATER
MTU 1500 bytes, BW 100000 Kbit/sec, DLY 100 usec,
reliability 255/255, txload 99/255, rxload 94/255
Encapsulation ARPA, loopback not set
Keepalive set (10 sec)
Full-duplex, 100Mb/s
ARP type: ARPA, ARP Timeout 04:00:00
Last input never, output never, output hang never
Last clearing of "show interface" counters never
Input queue: 0/75/40341/0 (size/max/drops/flushes); Total output drops: 0
Queueing strategy: fifo
Output queue: 0/40 (size/max)
5 minute input rate 37049000 bits/sec, 5810 packets/sec
5 minute output rate 38928000 bits/sec, 5909 packets/sec
12324124 packets input, 855031048 bytes, 0 no buffer
Received 211 broadcasts (0 multicasts)
0 runts, 0 giants, 0 throttles
0 input errors, 0 CRC, 0 frame, 0 overrun, 0 ignored
0 watchdog, 0 multicast, 0 pause input
0 input packets with dribble condition detected
12912889 packets output, 1892021583 bytes, 0 underruns
0 output errors, 0 collisions, 2 interface resets
0 unknown protocol drops
0 babbles, 0 late collision, 0 deferred
0 lost carrier, 0 no carrier, 0 pause output
0 output buffer failures, 0 output buffers swapped out
ROUTER#show int fa0/0/1 switching | i Drops
Drops RP 41172 SP 0
SPD Priority Inputs 0 Drops 0
And the interface is an access interface to VLAN10, so I'm not sure if this is normal:
FastEthernet0/0/1
Switching path Pkts In Chars In Pkts Out Chars Out
Processor 12729585 1202817196 13308563 2202992366
Route cache 0 0 0 0
Total 12729585 1202817196 13308563 2202992366
Vlan10
Switching path Pkts In Chars In Pkts Out Chars Out
Processor 682 91136 492 86741
Route cache 13039220 1439804318 13686842 2420832659
Total 13039902 1439895454 13687334 2420919400
And CPU never goes above 40%
100
90
80
70
60
50
40 **** *************** ***** *****
30 ************************************************************
20 ************************************************************
10 ************************************************************
0....5....1....1....2....2....3....3....4....4....5....5....6
0 5 0 5 0 5 0 5 0 5 0
CPU% per second (last 60 seconds)
3343344334333334343333344334334432222221 22122 1
982990088079788082987890096189014653234940181655467474453743
100
90
80
70
60
50
40 *##*########***####**#*#*#*#*###
30 #################################** *
20 #######################################* **### *
10 ######################################## #####** ** * * *
0....5....1....1....2....2....3....3....4....4....5....5....6
0 5 0 5 0 5 0 5 0 5 0
CPU% per minute (last 60 minutes)
* = maximum CPU% # = average CPU%
Hopefully someone can help me with this, thanks!
- Labels:
-
Other Switching
- Mark as New
- Bookmark
- Subscribe
- Mute
- Subscribe to RSS Feed
- Permalink
- Report Inappropriate Content
04-09-2013 07:04 AM
duplex mismatch?
- Mark as New
- Bookmark
- Subscribe
- Mute
- Subscribe to RSS Feed
- Permalink
- Report Inappropriate Content
04-09-2013 09:59 AM
Checked that, duplex and speed are fine.
It's obvious the RP is dropping packets, but I don't know why. Trying to figure out if the router is just undersized, or if there is another reason. The issue only happens with the router is sending data (around 35Mbps), but not when it is receiving the same amount of data.
- Mark as New
- Bookmark
- Subscribe
- Mute
- Subscribe to RSS Feed
- Permalink
- Report Inappropriate Content
04-09-2013 11:54 AM
I limited the traffic to 10Mbps on my Citrix Repeater, and the input drops have stopped. I thought the 2821 could handle more traffic than 10Mbps, but unless I'm missing something, looks like I need to upgrade to a 2921 to handle my 40Mbps WAN link.
- Mark as New
- Bookmark
- Subscribe
- Mute
- Subscribe to RSS Feed
- Permalink
- Report Inappropriate Content
04-09-2013 01:14 PM
Disclaimer
The Author of this posting offers the information contained within this posting without consideration and with the reader's understanding that there's no implied or expressed suitability or fitness for any purpose. Information provided is for informational purposes only and should not be construed as rendering professional advice of any kind. Usage of this posting's information is solely at reader's own risk.
Liability Disclaimer
In no event shall Author be liable for any damages whatsoever (including, without limitation, damages for loss of use, data or profit) arising out of the use or inability to use the posting's information even if Author has been advised of the possibility of such damage.
Posting
40 Mbps (duplex) can be a lot for a 2821, but the fact your CPU loading doesn't exceed about 40% gives hope for tuning improvement.
Have you tried increasing the input queue depth? An issue with a 2821, it can't keep up with a 100 Mbps burst.
If you increase the ingress queue depth, you may see drops increase and cpu loading increase.
- Mark as New
- Bookmark
- Subscribe
- Mute
- Subscribe to RSS Feed
- Permalink
- Report Inappropriate Content
04-09-2013 01:39 PM
Joseph-
Thanks, I was hoping you would drop in. I set the transmit traffic limit on my Citrix Repeater to 15Mbps and then set the input queue on the fa0/0/1 access port and vlan10 to:
#hold-queue 125 in
#hold-queue 150 in
#hold-queue 200 in
I kept going up, but I am still consistently dropping packets. Strangely, I didn't see the CPU usage go up (currently at 20%). The input queue is also always reporting 0 under the "show int" command, even though it is dropping packets:
FastEthernet0/0/1 is up, line protocol is up
Hardware is Fast Ethernet, address is 0025.840c.7680 (bia 0025.840c.7680)
Description: REPEATER
MTU 1500 bytes, BW 100000 Kbit/sec, DLY 100 usec,
reliability 255/255, txload 52/255, rxload 38/255
Encapsulation ARPA, loopback not set
Keepalive set (10 sec)
Full-duplex, 100Mb/s
ARP type: ARPA, ARP Timeout 04:00:00
Last input never, output never, output hang never
Last clearing of "show interface" counters never
Input queue: 0/200/156784/0 (size/max/drops/flushes); Total output drops: 0
Queueing strategy: fifo
Output queue: 0/40 (size/max)
5 minute input rate 15075000 bits/sec, 2750 packets/sec
5 minute output rate 20499000 bits/sec, 2921 packets/sec
180953912 packets input, 2278792782 bytes, 0 no buffer
Received 5360 broadcasts (0 multicasts)
0 runts, 0 giants, 0 throttles
0 input errors, 0 CRC, 0 frame, 0 overrun, 0 ignored
0 watchdog, 0 multicast, 0 pause input
0 input packets with dribble condition detected
162046993 packets output, 3213558743 bytes, 0 underruns
0 output errors, 0 collisions, 2 interface resets
0 unknown protocol drops
0 babbles, 0 late collision, 0 deferred
0 lost carrier, 0 no carrier, 0 pause output
0 output buffer failures, 0 output buffers swapped out
- Mark as New
- Bookmark
- Subscribe
- Mute
- Subscribe to RSS Feed
- Permalink
- Report Inappropriate Content
04-09-2013 02:52 PM
Why don't you configure interface history and find out exactly what's dropping?
conf t
interface f0/1/0
history bps [options]
end
Wait for about 5 minutes ...
sh interface f 0/1/0 history
- Mark as New
- Bookmark
- Subscribe
- Mute
- Subscribe to RSS Feed
- Permalink
- Report Inappropriate Content
04-09-2013 04:11 PM
leolaohoo, I haven't used the interface history command extensively, but I configured it and I'm not sure how it will show me exactly what is dropping. I configured the following on the interface:
#history BPS input-drops input-errors frame-errors unknown-protocol-drops pause-input
And after a couple minutes got this:
111111111111111111111111111111111111111111111111111111111111
999999999999999999999999999999999999999999999999999999999999
000011111111112222222222333333333344444444445555566666666667
666611111666661111166666222228888833333999995555511111777773
111111111333337777799999666662222299999777775555577777666667
19760 *
19690 ******
19620 ***********
19550 ****************
19480 *********************
19410 *******************************
19340 ************************************
19270 *****************************************
19200 **********************************************
19130 ********************************************************
19060 ************************************************************
0....5....1....1....2....2....3....3....4....4....5....5....6
0 5 0 5 0 5 0 5 0 5 0
iPaus 000000000000000000000000000000000000000000000000000000000000
FrErr 000000000000000000000000000000000000000000000000000000000000
iErr 000000000000000000000000000000000000000000000000000000000000
1 8 2 4 5 1 4 3 4 3 1 3 4 5 2 3 3 2 4 2 1 11 5 54 2
iDrop 407000805090705040103000090500060705000503090907044010016080
FastEthernet0/0/1 input rate(kbits/sec) (last 60 seconds)
2222221111
0110009876
1009646785
3445444540
2996698794
22000
20900 ####*
19800 ######*
18700 ########
17600 #########
16500 #########*
15400 #########*
14300 #########*
13200 #########*
12100 #########*
11000 ##########
0....5....1....1....2....2....3....3....4....4....5....5....6
0 5 0 5 0 5 0 5 0 5 0
iPaus 000000000000000000000000000000000000000000000000000000000000
FrErr 000000000000000000000000000000000000000000000000000000000000
iErr 000000000000000000000000000000000000000000000000000000000000
1 11111
8829201116
8027678676
iDrop 989298892900000000000000000000000000000000000000000000000000
FastEthernet0/0/1 input rate(kbits/sec) (last 60 minutes)
* = maximum # = average
If you have any other suggestions on what parameters to configure, please let me know. Thanks
- Mark as New
- Bookmark
- Subscribe
- Mute
- Subscribe to RSS Feed
- Permalink
- Report Inappropriate Content
04-09-2013 06:49 PM
Disclaimer
The Author of this posting offers the information contained within this posting without consideration and with the reader's understanding that there's no implied or expressed suitability or fitness for any purpose. Information provided is for informational purposes only and should not be construed as rendering professional advice of any kind. Usage of this posting's information is solely at reader's own risk.
Liability Disclaimer
In no event shall Author be liable for any damages whatsoever (including, without limitation, damages for loss of use, data or profit) arising out of the use or inability to use the posting's information even if Author has been advised of the possibility of such damage.
Posting
Hmm, interesting. Try setting the ingress queue to max.
Also, your WCCP redirection is on the LAN side, set for ingress? Is the WCCP server on the same subnet as the router interface?
- Mark as New
- Bookmark
- Subscribe
- Mute
- Subscribe to RSS Feed
- Permalink
- Report Inappropriate Content
04-10-2013 10:06 AM
Set the ingress queues to max, still dropping packets.
FastEthernet0/0/1 is up, line protocol is up
Hardware is Fast Ethernet, address is 0025.840c.7680 (bia 0025.840c.7680)
Description: REPEATER
MTU 1500 bytes, BW 100000 Kbit/sec, DLY 100 usec,
reliability 255/255, txload 45/255, rxload 13/255
Encapsulation ARPA, loopback not set
Keepalive set (10 sec)
Full-duplex, 100Mb/s
ARP type: ARPA, ARP Timeout 04:00:00
Last input never, output never, output hang never
Last clearing of "show interface" counters never
Input queue: 0/240000/312995/0 (size/max/drops/flushes); Total output drops: 0
Queueing strategy: fifo
Output queue: 0/40 (size/max)
5 minute input rate 5326000 bits/sec, 1644 packets/sec
5 minute output rate 17916000 bits/sec, 2310 packets/sec
295789900 packets input, 2461398633 bytes, 0 no buffer
Received 9255 broadcasts (0 multicasts)
0 runts, 0 giants, 0 throttles
0 input errors, 0 CRC, 0 frame, 0 overrun, 0 ignored
0 watchdog, 0 multicast, 0 pause input
0 input packets with dribble condition detected
272426380 packets output, 707468749 bytes, 0 underruns
0 output errors, 0 collisions, 2 interface resets
0 unknown protocol drops
0 babbles, 0 late collision, 0 deferred
0 lost carrier, 0 no carrier, 0 pause output
0 output buffer failures, 0 output buffers swapped out
then about 3 min later:
FastEthernet0/0/1 is up, line protocol is up
Hardware is Fast Ethernet, address is 0025.840c.7680 (bia 0025.840c.7680)
Description: REPEATER
MTU 1500 bytes, BW 100000 Kbit/sec, DLY 100 usec,
reliability 255/255, txload 57/255, rxload 25/255
Encapsulation ARPA, loopback not set
Keepalive set (10 sec)
Full-duplex, 100Mb/s
ARP type: ARPA, ARP Timeout 04:00:00
Last input never, output never, output hang never
Last clearing of "show interface" counters never
Input queue: 0/240000/316026/0 (size/max/drops/flushes); Total output drops: 0
Queueing strategy: fifo
Output queue: 0/40 (size/max)
5 minute input rate 10117000 bits/sec, 2435 packets/sec
5 minute output rate 22454000 bits/sec, 3236 packets/sec
296650144 packets input, 2941044132 bytes, 0 no buffer
Received 9271 broadcasts (0 multicasts)
0 runts, 0 giants, 0 throttles
0 input errors, 0 CRC, 0 frame, 0 overrun, 0 ignored
0 watchdog, 0 multicast, 0 pause input
0 input packets with dribble condition detected
273552018 packets output, 1651097814 bytes, 0 underruns
0 output errors, 0 collisions, 2 interface resets
0 unknown protocol drops
0 babbles, 0 late collision, 0 deferred
0 lost carrier, 0 no carrier, 0 pause output
0 output buffer failures, 0 output buffers swapped out
And yes, my WCCP redirection is set on the LAN int (ip wccp ## redirect in), and the WCCP server is on the same subnet as the router interface.
I'm going through the Citrix Repeater documentation to see if I can find something, and I did see this: " Acceleration units detect each other’s presence automatically, in a patent-pending process called autodiscovery. This is done by attaching TCP header options to the first packets in each connection -- the SYN packet (sent by the client to the server to open the connection), and the SYN-ACK packet (sent by the server to the client to indicate that the connection has been accepted). By tagging the SYN packets and listening for tagged SYN and SYN-ACK packets, the Appliances can detect each others’ presence in real time, on a connection-by-connection basis."
Would these TCP header options be impacting the router at all?
- Mark as New
- Bookmark
- Subscribe
- Mute
- Subscribe to RSS Feed
- Permalink
- Report Inappropriate Content
04-10-2013 01:21 PM
And to add one more thing, I can receive 40Mbps of WAN traffic to the 2821, go through the Repeater interface and back out to the LAN and be perfectly fine, no dropped packets. But if the traffic originates from the 2821 LAN, then I get the dropped packets on the fa0/0/1 interface...would this have to do with the encapsulation of the packets for the GRE tunnel?
- Mark as New
- Bookmark
- Subscribe
- Mute
- Subscribe to RSS Feed
- Permalink
- Report Inappropriate Content
04-10-2013 05:49 PM
Disclaimer
The Author of this posting offers the information contained within this posting without consideration and with the reader's understanding that there's no implied or expressed suitability or fitness for any purpose. Information provided is for informational purposes only and should not be construed as rendering professional advice of any kind. Usage of this posting's information is solely at reader's own risk.
Liability Disclaimer
In no event shall Author be liable for any damages whatsoever (including, without limitation, damages for loss of use, data or profit) arising out of the use or inability to use the posting's information even if Author has been advised of the possibility of such damage.
Posting
Some header options can cause process switching, I believe. What's your CPU stats look like when 2821 is pushing high load (particularly total CPU vs. interrupt CPU percentages)?
What IOS version are you running?
See if you get any stats for show spd or show ip spd.
Normally as long as GRE packets aren't being created on the router (which is why I asked if the WCCP server was on the same subnet as the router interface), they should be treated like any other packet (assuming there's not some issue related to special header options). (WCCP encapsulation might be confirmed with showing WCCP detail stats.)
It's curious you never see any packets queued in the ingress queue, yet even with max queue setting, packets are being dropped. Also curious no significant improvement (decrease in drops) or increased CPU. Normally, ingress queue drops indicate the processor cannot keep up with packet bursts. Drops going down when you decreased the transmission rate to the 2821 makes sense, the other stats don't with the increase queue depth.
- Mark as New
- Bookmark
- Subscribe
- Mute
- Subscribe to RSS Feed
- Permalink
- Report Inappropriate Content
04-18-2013 10:59 AM
The router has dropped about 17000 packets in the last hour, and CPU isn't that high at all (but interrupt is about equal):
Interface load:
FastEthernet0/0/1 is up, line protocol is up
Hardware is Fast Ethernet, address is 0025.840c.7680 (bia 0025.840c.7680)
Description: REPEATER
MTU 1500 bytes, BW 100000 Kbit/sec, DLY 100 usec,
reliability 255/255, txload 60/255, rxload 25/255
Input queue: 0/100/449942/0 (size/max/drops/flushes); Total output drops: 0
ROUTER#show proc cpu sort 5min | i CPU
CPU utilization for five seconds: 22%/19%; one minute: 20%; five minutes: 17%
ROUTER#show proc cpu sort 5min
CPU utilization for five seconds: 19%/17%; one minute: 15%; five minutes: 15%
PID Runtime(ms) Invoked uSecs 5Sec 1Min 5Min TTY Process
102 29388 110074795 0 0.23% 0.28% 0.29% 0 Ethernet Msec Ti
5 1764728 148325 11897 0.79% 0.16% 0.12% 0 Check heaps
126 8276 27069995 0 0.07% 0.07% 0.07% 0 IPAM Manager
264 4676 1362 3433 0.07% 0.10% 0.06% 514 Virtual Exec
130 335448 769974 435 0.07% 0.03% 0.02% 0 IP Input
2 89388 173561 515 0.00% 0.03% 0.02% 0 Load Meter
304 377548 272469 1385 0.00% 0.00% 0.00% 0 SNMP ENGINE
78 548 3471187 0 0.07% 0.00% 0.00% 0 Netclock Backgro
161 7428 957011 7 0.07% 0.01% 0.00% 0 CEF: IPv4 proces
29 46692 80574 579 0.07% 0.00% 0.00% 0 ARP Input
178 1412 867727 1 0.00% 0.00% 0.00% 0 RUDPV1 Main Proc
12 836 173543 4 0.00% 0.00% 0.00% 0 IPC Event Notifi
13 288 14463 19 0.00% 0.00% 0.00% 0 IPC Dynamic Cach
14 0 1 0 0.00% 0.00% 0.00% 0 IPC Session Serv
15 0 1 0 0.00% 0.00% 0.00% 0 IPC Zone Manager
16 208 847414 0 0.00% 0.00% 0.00% 0 IPC Periodic Tim
17 192 847414 0 0.00% 0.00% 0.00% 0 IPC Deferred Por
18 0 1 0 0.00% 0.00% 0.00% 0 IPC Process leve
19 0 1 0 0.00% 0.00% 0.00% 0 IPC Seat Manager
20 16 49590 0 0.00% 0.00% 0.00% 0 IPC Check Queue
Here is the spd output you requested:
ROUTER#show ip spd
Current mode: normal.
Queue min/max thresholds: 73/74, Headroom: 100, Extended Headroom: 75
IP normal queue: 0, priority queue: 0.
SPD special drop mode: none
I also ran "debug ip packet detail" to try and get more insight, and I am trying to understand the output, but I did notice these (they are not directly consecutive in the output, but I didn't want to post all the logs)
*Apr 18 17:35:20.456: FIBipv4-packet-proc: packet routing failed
*Apr 18 17:35:20.500: FIBipv4-packet-proc: packet routing failed
*Apr 18 17:35:20.604: FIBipv4-packet-proc: packet routing failed
*Apr 18 17:35:20.788: FIBipv4-packet-proc: packet routing failed
And finally my IOS ver:
Cisco IOS Software, 2800 Software (C2800NM-ADVSECURITYK9-M), Version 15.1(4)M1, RELEASE SOFTWARE (fc1)
- Mark as New
- Bookmark
- Subscribe
- Mute
- Subscribe to RSS Feed
- Permalink
- Report Inappropriate Content
04-18-2013 03:04 PM
I thought I potentially found a bug (CSCsj48440 - WCCP: L2 return traffic is software switched) and I implemented the workaround of applying the "ip wccp redirect exclude in" to the appliance facing interface, but the drops still continued (unless it takes a while to apply?)...
- Mark as New
- Bookmark
- Subscribe
- Mute
- Subscribe to RSS Feed
- Permalink
- Report Inappropriate Content
04-19-2013 03:29 AM
Disclaimer
The Author of this posting offers the information contained within this posting without consideration and with the reader's understanding that there's no implied or expressed suitability or fitness for any purpose. Information provided is for informational purposes only and should not be construed as rendering professional advice of any kind. Usage of this posting's information is solely at reader's own risk.
Liability Disclaimer
In no event shall Author be liable for any damages whatsoever (including, without limitation, damages for loss of use, data or profit) arising out of the use or inability to use the posting's information even if Author has been advised of the possibility of such damage.
Posting
I thought I potentially found a bug (CSCsj48440 - WCCP: L2 return traffic is software switched) and I implemented the workaround of applying the "ip wccp redirect exclude in" to the appliance facing interface, but the drops still continued (unless it takes a while to apply?)...If there's a delay, it might be due to WCCP session needing to be reset between the router and WCCP server.
To you have a service contract? We're getting to the poing that you might need TAC.
Discover and save your favorite ideas. Come back to expert answers, step-by-step guides, recent topics, and more.
New here? Get started with these tips. How to use Community New member guide