- Cisco Community
- Technology and Support
- Networking
- Switching
- Hulc LED Process uses 6-23%
- Subscribe to RSS Feed
- Mark Topic as New
- Mark Topic as Read
- Float this Topic for Current User
- Bookmark
- Subscribe
- Mute
- Printer Friendly Page
2960X high Utilisation in CPU each and everyday
- Mark as New
- Bookmark
- Subscribe
- Mute
- Subscribe to RSS Feed
- Permalink
- Report Inappropriate Content
05-05-2016 07:12 AM - edited 03-08-2019 05:37 AM
")
")
- Mark as New
- Bookmark
- Subscribe
- Mute
- Subscribe to RSS Feed
- Permalink
- Report Inappropriate Content
05-05-2016 07:15 AM
You need to post the show proc cpu sorted while its high to see what process is causing it
- Mark as New
- Bookmark
- Subscribe
- Mute
- Subscribe to RSS Feed
- Permalink
- Report Inappropriate Content
05-05-2016 07:32 AM
show proc cpu sorted
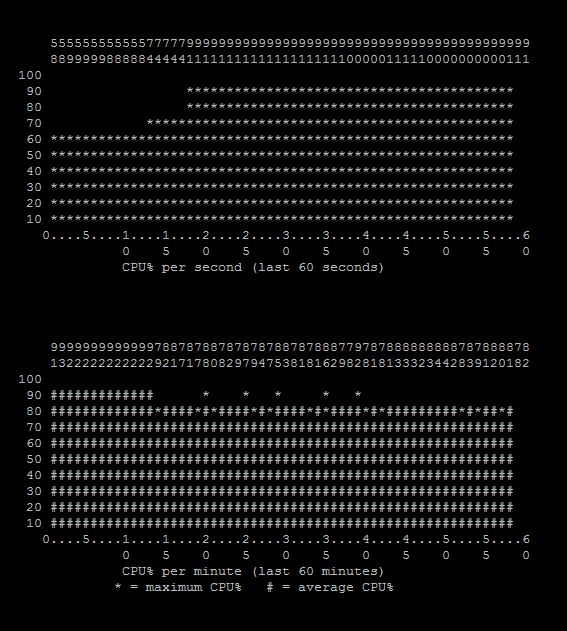
CPU utilization for five seconds: 59%/26%; one minute: 59%; five minutes: 60%
PID Runtime(ms) Invoked uSecs 5Sec 1Min 5Min TTY Process
163 2331774448 291273722 8005 16.56% 15.85% 15.75% 0 Hulc LED Process
132 26314101 11674322 2254 0.54% 0.40% 0.41% 0 hpm counter proc
195 9889394 11353761 871 0.54% 0.32% 0.29% 0 CDP Protocol
174 42901985 2323699 18462 0.35% 0.37% 0.36% 0 HQM Stack Proces
221 7347409 27708044 265 0.17% 0.18% 0.18% 0 Spanning Tree
93 26304546 526331867 49 0.17% 0.13% 0.12% 0 RedEarth Rx Mana
92 4673178 525822621 8 0.11% 0.08% 0.11% 0 RedEarth Tx Mana
122 22905205 313191605 73 0.11% 0.11% 0.11% 0 HLFM address lea
207 8257335 313191937 26 0.11% 0.04% 0.04% 0 IP ARP Retry Age
63 3887726 11674885 332 0.11% 0.09% 0.06% 0 Per-Second Jobs
175 17382896 9246908 1879 0.11% 0.22% 0.23% 0 HRPC qos request
133 3391972 15655588 216 0.11% 0.06% 0.06% 0 HRPC pm-counters
128 12581129 169852217 74 0.11% 0.06% 0.10% 0 hpm main process
61 1363123 2335153 583 0.05% 0.01% 0.00% 0 Compute load avg
238 17002007 116593863 145 0.05% 0.14% 0.12% 0 UDLD
100 3626451 17206361 210 0.05% 0.05% 0.05% 0 hrpc <- response
293 1444798 13179145 109 0.05% 0.00% 0.00% 0 Inline Power
254 2271946 4135274 549 0.05% 0.08% 0.06% 0 XDR mcast rcv
18 265996 12216816 21 0.00% 0.00% 0.00% 0 ARP Background
19 0 1 0 0.00% 0.00% 0.00% 0 AAA_SERVER_DEADT
20 0 1 0 0.00% 0.00% 0.00% 0 Policy Manager
22 0 1 0 0.00% 0.00% 0.00% 0 IFS Agent Manage
21 42 13 3230 0.00% 0.00% 0.00% 0 Entity MIB API
24 141703 11371654 12 0.00% 0.00% 0.00% 0 IPC Mcast Pendin
14 5595 194242 28 0.00% 0.00% 0.00% 0 IPC Dynamic Cach
26 0 1 0 0.00% 0.00% 0.00% 0 IPC Zone Manager
27 166384 11371654 14 0.00% 0.00% 0.00% 0 IPC Periodic Tim
13 0 1 0 0.00% 0.00% 0.00% 0 License Client N
12 720499 46635527 15 0.00% 0.00% 0.00% 0 HUSB Console
17 101365 222267 456 0.00% 0.00% 0.00% 0 ARP Input
11 536 29614 18 0.00% 0.00% 0.00% 0 WATCH_AFS
32 21 71 295 0.00% 0.00% 0.00% 0 IPC Seat RX Cont
16 6669868 194236 34338 0.00% 0.03% 0.00% 0 Licensing Auto U
15 0 1 0 0.00% 0.00% 0.00% 0 Image License br
10 0 2 0 0.00% 0.00% 0.00% 0 Timers
9 0 1 0 0.00% 0.00% 0.00% 0 DiscardQ Backgro
8 9775 9147 1068 0.00% 0.00% 0.00% 0 Pool Manager
23 22819 2323753 9 0.00% 0.00% 0.00% 0 IPC Event Notifi
25 0 1 0 0.00% 0.00% 0.00% 0 IPC Session Serv
40 0 7 0 0.00% 0.00% 0.00% 0 License IPC stat
41 0 1 0 0.00% 0.00% 0.00% 0 License IPC serv
PID Runtime(ms) Invoked uSecs 5Sec 1Min 5Min TTY Process
28 133157 11371654 11 0.00% 0.00% 0.00% 0 IPC Deferred Por
43 0 1 0 0.00% 0.00% 0.00% 0 client_entity_se
44 0 2 0 0.00% 0.00% 0.00% 0 SMART
45 0 2 0 0.00% 0.00% 0.00% 0 XML Proxy Client
46 0 1 0 0.00% 0.00% 0.00% 0 ARP Snoop
47 76538 11617634 6 0.00% 0.00% 0.00% 0 Dynamic ARP Insp
48 0 1 0 0.00% 0.00% 0.00% 0 Critical Bkgnd
29 0 1 0 0.00% 0.00% 0.00% 0 IPC Process leve
30 0 9 0 0.00% 0.00% 0.00% 0 IPC Seat Manager
51 35803 123420 290 0.00% 0.00% 0.00% 0 Logger
52 110160 11617576 9 0.00% 0.00% 0.00% 0 TTY Background
31 8051 666874 12 0.00% 0.00% 0.00% 0 IPC Check Queue
33 0 1 0 0.00% 0.00% 0.00% 0 IPC Seat TX Cont
55 20 75 266 0.00% 0.00% 0.00% 0 IF-MGR control p
56 666 54473 12 0.00% 0.00% 0.00% 0 IF-MGR event pro
57 0 1 0 0.00% 0.00% 0.00% 0 ICC Nego
58 0 1 0 0.00% 0.00% 0.00% 0 Inode Table Dest
34 24945 1167482 21 0.00% 0.00% 0.00% 0 IPC Keep Alive M
60 29353 601269 48 0.00% 0.00% 0.00% 0 Net Input
35 87943 2330821 37 0.00% 0.00% 0.00% 0 IPC Loadometer
62 2377050 198414 11980 0.00% 0.01% 0.00% 0 Per-minute Jobs
36 52 4 13000 0.00% 0.00% 0.00% 0 PrstVbl
64 0 1 0 0.00% 0.00% 0.00% 0 AggMgr Process
37 0 1 0 0.00% 0.00% 0.00% 0 Crash writer
66 272711 3420359 79 0.00% 0.00% 0.00% 0 HC Counter Timer
38 0 1 0 0.00% 0.00% 0.00% 0 Exception contro
39 600 117 5128 0.00% 0.00% 0.00% 0 crypto sw pk pro
69 0 50 0 0.00% 0.00% 0.00% 0 EEM ED MAT
42 173985 11674306 14 0.00% 0.00% 0.00% 0 GraphIt
71 1136 11 103272 0.00% 0.00% 0.00% 0 USB Startup
72 0 2 0 0.00% 0.00% 0.00% 0 APM 86392 RTC
73 3837333 218295541 17 0.00% 0.00% 0.00% 0 DownWhenLooped
74 0 1 0 0.00% 0.00% 0.00% 0 HRPC power_mgmt
75 0 2 0 0.00% 0.00% 0.00% 0 Porter Power Man
76 0 1 0 0.00% 0.00% 0.00% 0 HULC ACL Tcam Me
49 3581306 2251700 1590 0.00% 0.02% 0.05% 0 Net Background
78 0 1 0 0.00% 0.00% 0.00% 0 HRPC lpip reques
79 0 2 0 0.00% 0.00% 0.00% 0 HLPIP Sync Proce
80 0 1 0 0.00% 0.00% 0.00% 0 HRPC hnetwpol re
81 0 1 0 0.00% 0.00% 0.00% 0 HRPC EnergyWise
82 0 1 0 0.00% 0.00% 0.00% 0 HRPC actual powe
83 0 1 0 0.00% 0.00% 0.00% 0 HRPC ipadm reque
84 12564136 390189206 32 0.00% 0.05% 0.03% 0 Draught link sta
PID Runtime(ms) Invoked uSecs 5Sec 1Min 5Min TTY Process
85 17075 388481 43 0.00% 0.00% 0.00% 0 PSP Timer
86 0 1 0 0.00% 0.00% 0.00% 0 HULC QM Tcam Mem
87 6 17 352 0.00% 0.00% 0.00% 0 Stack DI Update
7 34354188 2851030 12049 0.00% 0.27% 0.23% 0 Check heaps
89 0 1 0 0.00% 0.00% 0.00% 0 HRPC asic-stats
90 12418 1435691 8 0.00% 0.00% 0.00% 0 Adjust Regions
50 0 2 0 0.00% 0.00% 0.00% 0 IDB Work
53 19 222 85 0.00% 0.00% 0.00% 0 SXP CORE
6 0 1 0 0.00% 0.00% 0.00% 0 IPC ISSU Dispatc
94 169141 2334951 72 0.00% 0.00% 0.00% 0 HULC Thermal Pro
95 0 3 0 0.00% 0.00% 0.00% 0 HRPC hsm request
96 22 42 523 0.00% 0.00% 0.00% 0 Stack Mgr
97 982 220 4463 0.00% 0.00% 0.00% 0 Stack Mgr Notifi
54 0 1 0 0.00% 0.00% 0.00% 0 Cat6k NTI ICC pr
99 360693 10249656 35 0.00% 0.00% 0.00% 0 hrpc -> request
59 0 6 0 0.00% 0.00% 0.00% 0 IP Admission HA
101 0 7 0 0.00% 0.00% 0.00% 0 HRPC hcomp reque
102 759732 58289519 13 0.00% 0.00% 0.00% 0 apm86xxx_enet_pr
103 0 35 0 0.00% 0.00% 0.00% 0 HULC Device Mana
5 0 1 0 0.00% 0.00% 0.00% 0 Retransmission o
105 4 22 181 0.00% 0.00% 0.00% 0 HRPC hdm blockin
106 58169 2323742 25 0.00% 0.00% 0.00% 0 HIPC bkgrd proce
107 0 1 0 0.00% 0.00% 0.00% 0 RTTYS Process
108 1925 28620 67 0.00% 0.00% 0.00% 0 Hulc Port-Securi
109 9697 122247 79 0.00% 0.00% 0.00% 0 HRPC hpsecure re
110 0 1 0 0.00% 0.00% 0.00% 0 HRPC hrcmd reque
65 0 1052 0 0.00% 0.00% 0.00% 0 Transport Port A
112 7813 77201 101 0.00% 0.00% 0.00% 0 HRPC hulc misc r
113 39173 3884681 10 0.00% 0.00% 0.00% 0 HVLAN main bkgrd
114 0 2 0 0.00% 0.00% 0.00% 0 HVLAN Mapped Vla
115 0 2 0 0.00% 0.00% 0.00% 0 Vlan shutdown Pr
116 3 80 37 0.00% 0.00% 0.00% 0 HRPC vlan reques
117 0 1 0 0.00% 0.00% 0.00% 0 HULC VLAN REF Ba
118 0 7 0 0.00% 0.00% 0.00% 0 HRPC ilp request
4 2986 100527 29 0.00% 0.00% 0.00% 0 DHCPD Timer
120 418183 776938 538 0.00% 0.00% 0.00% 0 Strider Tcam Mem
121 857833 6306488 136 0.00% 0.00% 0.00% 0 HRPC hlfm reques
67 19026011 38861 489654 0.00% 0.00% 0.00% 0 SFF8472
123 274642 11617578 23 0.00% 0.00% 0.00% 0 HLFM aging proce
124 38655 3972763 9 0.00% 0.00% 0.00% 0 HLFM address ret
125 0 1 0 0.00% 0.00% 0.00% 0 HULC PM Vector P
126 0 1 0 0.00% 0.00% 0.00% 0 HPM Msg Retry Pr
68 0 80 0 0.00% 0.00% 0.00% 0 EEM ED Identity
PID Runtime(ms) Invoked uSecs 5Sec 1Min 5Min TTY Process
70 40708 973840 41 0.00% 0.00% 0.00% 0 EEM ED ND
129 2030 29581 68 0.00% 0.00% 0.00% 0 HPM Stack Sync P
130 74971 318271 235 0.00% 0.00% 0.00% 0 HRPC pm request
131 0 7 0 0.00% 0.00% 0.00% 0 HPM if_num mappi
3 546 4227 129 0.00% 0.00% 0.00% 0 hulc_entropy_thr
77 0 1 0 0.00% 0.00% 0.00% 0 Hulc EEM Process
134 3 8 375 0.00% 0.00% 0.00% 0 hpm vp events ca
135 0 1 0 0.00% 0.00% 0.00% 0 HRPC hcmp reques
136 1693 5561 304 0.00% 0.00% 0.00% 0 HCEF ADJ Refresh
137 0 1 0 0.00% 0.00% 0.00% 0 HACL Queue Proce
138 0 1 0 0.00% 0.00% 0.00% 0 HRPC acl request
139 0 59 0 0.00% 0.00% 0.00% 0 HACL Acl Manager
140 0 1 0 0.00% 0.00% 0.00% 0 HRPC aim request
141 0 1 0 0.00% 0.00% 0.00% 0 HRPC backup inte
142 25013 3555 7036 0.00% 0.00% 0.00% 0 OBFL UPTIME obfl
143 0 1 0 0.00% 0.00% 0.00% 0 HRPC cdp request
144 0 10 0 0.00% 0.00% 0.00% 0 HULC CISP Proces
145 19985 195995 101 0.00% 0.00% 0.00% 0 HRPC dot1x reque
146 0 9 0 0.00% 0.00% 0.00% 0 Dot1X Msg Retry
91 358987 23326498 15 0.00% 0.00% 0.00% 0 FlexStack Hotswa
148 0 1 0 0.00% 0.00% 0.00% 0 HRPC lldp reques
149 0 7 0 0.00% 0.00% 0.00% 0 HRPC system mtu
150 3 12 250 0.00% 0.00% 0.00% 0 HRPC rep request
151 0 9 0 0.00% 0.00% 0.00% 0 REP Helper Proc
152 0 1 0 0.00% 0.00% 0.00% 0 HRPC sdm request
153 0 1 0 0.00% 0.00% 0.00% 0 SMI MSG Retry Pr
154 0 1 0 0.00% 0.00% 0.00% 0 HRPC Smart Insta
155 1355320 57656056 23 0.00% 0.00% 0.00% 0 Hulc Storm Contr
156 0 2 0 0.00% 0.00% 0.00% 0 HSTP Sync Proces
157 0 1 0 0.00% 0.00% 0.00% 0 HRPC stp_cli req
158 14 57 245 0.00% 0.00% 0.00% 0 HRPC stp_state_s
159 0 2 0 0.00% 0.00% 0.00% 0 S/W Bridge Proce
160 0 25 0 0.00% 0.00% 0.00% 0 HRPC hudld reque
161 0 1 0 0.00% 0.00% 0.00% 0 HRPC vqpc reques
162 0 1 0 0.00% 0.00% 0.00% 0 HRPC hled reques
2 322175 2334949 137 0.00% 0.00% 0.00% 0 Load Meter
164 340554 8546202 39 0.00% 0.00% 0.00% 0 HL3U bkgrd proce
165 669233 4666383 143 0.00% 0.00% 0.00% 0 HRPC hl3u reques
166 204340 2665571 76 0.00% 0.00% 0.00% 0 HIPV6 bkgrd proc
167 667479 4666387 143 0.00% 0.00% 0.00% 0 HRPC IPv6 Unicas
168 0 1 0 0.00% 0.00% 0.00% 0 HRPC obfl reques
169 0 11 0 0.00% 0.00% 0.00% 0 OBFL Cfg Dispatc
170 0 1 0 0.00% 0.00% 0.00% 0 HRPC dtp request
PID Runtime(ms) Invoked uSecs 5Sec 1Min 5Min TTY Process
171 0 1 0 0.00% 0.00% 0.00% 0 HRPC show_forwar
172 0 1 0 0.00% 0.00% 0.00% 0 HRPC snmp reques
173 0 1 0 0.00% 0.00% 0.00% 0 HULC SNMP Proces
88 1421 7003 202 0.00% 0.00% 0.00% 0 SpanTree Helper
1 56408 421194 133 0.00% 0.00% 0.00% 0 Chunk Manager
176 0 1 0 0.00% 0.00% 0.00% 0 HRPC span reques
177 26 32 812 0.00% 0.00% 0.00% 0 HRPC system post
178 4 25 160 0.00% 0.00% 0.00% 0 Hulc Reload Mana
179 0 1 0 0.00% 0.00% 0.00% 0 Hulc Blue Beacon
180 20 71 281 0.00% 0.00% 0.00% 0 HRPC hrcli-event
181 2051 64860 31 0.00% 0.00% 0.00% 0 HCMP sync proces
182 36746 11022 3333 0.00% 0.00% 0.00% 0 image mgr
183 0 1 0 0.00% 0.00% 0.00% 0 HRFS OIR Proc
98 197527 5827060 33 0.00% 0.00% 0.00% 0 hrpc -> response
185 4999 13876 360 0.00% 0.00% 0.00% 0 HL2MCM
186 3 21 142 0.00% 0.00% 0.00% 0 HL2MCM
187 3 94 31 0.00% 0.00% 0.00% 0 AAA Server
188 0 1 0 0.00% 0.00% 0.00% 0 AAA ACCT Proc
189 0 1 0 0.00% 0.00% 0.00% 0 ACCT Periodic Pr
190 0 1 0 0.00% 0.00% 0.00% 0 AAA System Acct
191 0 1 0 0.00% 0.00% 0.00% 0 AUTH POLICY Fram
192 230917 11380609 20 0.00% 0.00% 0.00% 0 Auth Manager
193 0 1 0 0.00% 0.00% 0.00% 0 Auth-proxy AAA B
194 719 38916 18 0.00% 0.00% 0.00% 0 IP Admin SM Proc
104 21255 76097 279 0.00% 0.00% 0.00% 0 HRPC hdm non blo
196 28 5 5600 0.00% 0.00% 0.00% 0 OBFL MSG obfl0
197 669384 18052065 37 0.00% 0.00% 0.00% 0 CEF: IPv4 proces
198 0 2 0 0.00% 0.00% 0.00% 0 CMD HANDLER
199 0 2 0 0.00% 0.00% 0.00% 0 AAA Dictionary R
200 2625 97291 26 0.00% 0.00% 0.00% 0 DHCP Snooping
201 0 1 0 0.00% 0.00% 0.00% 0 DHCP Snooping db
202 80 573 139 0.00% 0.00% 0.00% 0 Dot1x Mgr Proces
203 0 1 0 0.00% 0.00% 0.00% 0 EAP Framework
204 0 1 0 0.00% 0.00% 0.00% 0 EAP Test
205 0 2 0 0.00% 0.00% 0.00% 0 CEF switching ba
206 4 4 1000 0.00% 0.00% 0.00% 0 IP ARP Adjacency
111 9 63 142 0.00% 0.00% 0.00% 0 HRPC emac reques
208 1138946 9764564 116 0.00% 0.00% 0.00% 0 IP Input
209 0 1 0 0.00% 0.00% 0.00% 0 ICMP event handl
210 836373 22441229 37 0.00% 0.00% 0.00% 0 IP ARP Track
211 0 1 0 0.00% 0.00% 0.00% 0 ADJ NSF process
212 0 1 0 0.00% 0.00% 0.00% 0 IPv6 ping proces
213 31 2 15500 0.00% 0.00% 0.00% 0 OBFL ENV obfl0
PID Runtime(ms) Invoked uSecs 5Sec 1Min 5Min TTY Process
214 0 2 0 0.00% 0.00% 0.00% 0 REP Topology cha
215 0 5 0 0.00% 0.00% 0.00% 0 SMI Director DB
216 5278 216177 24 0.00% 0.00% 0.00% 0 SMI CDP Update H
217 0 1 0 0.00% 0.00% 0.00% 0 SMI Backup Proce
218 0 2 0 0.00% 0.00% 0.00% 0 SMI IBC server p
219 0 1 0 0.00% 0.00% 0.00% 0 SMI IBC client p
220 0 2 0 0.00% 0.00% 0.00% 0 SMI IBC Download
119 143091 11617592 12 0.00% 0.00% 0.00% 0 Hulc ILP Alchemy
222 10820 194589 55 0.00% 0.00% 0.00% 0 Spanning Tree St
223 71014 64509 1100 0.00% 0.00% 0.00% 0 802.1x switch
224 0 1 0 0.00% 0.00% 0.00% 0 802.1x Webauth F
225 121630 777471 156 0.00% 0.00% 0.00% 0 DTP Protocol
226 0 7 0 0.00% 0.00% 0.00% 0 HRPC IPv6 Host r
227 0 2 0 0.00% 0.00% 0.00% 0 IPv6 Platform Ho
228 0 1 0 0.00% 0.00% 0.00% 0 HRPC dai request
229 0 1 0 0.00% 0.00% 0.00% 0 HULC DAI Process
230 0 1 0 0.00% 0.00% 0.00% 0 HRPC power down
231 0 1 0 0.00% 0.00% 0.00% 0 HRPC ip device t
232 0 1 0 0.00% 0.00% 0.00% 0 HRPC ip source g
233 0 1 0 0.00% 0.00% 0.00% 0 HULC IP Source g
234 0 1 0 0.00% 0.00% 0.00% 0 HRPC sisf reques
235 0 5 0 0.00% 0.00% 0.00% 0 HULC SISF Proces
236 0 1 0 0.00% 0.00% 0.00% 0 HULC SISF Source
237 1052689 11617574 90 0.00% 0.00% 0.00% 0 PI MATM Aging Pr
127 2432 38940 62 0.00% 0.00% 0.00% 0 OBFL TEMP obfl0
239 6518 389159 16 0.00% 0.00% 0.00% 0 Port-Security
240 0 2 0 0.00% 0.00% 0.00% 0 Switch Backup In
241 0 2 0 0.00% 0.00% 0.00% 0 IP Host Track Pr
242 0 1 0 0.00% 0.00% 0.00% 0 Link State Group
243 3345 194241 17 0.00% 0.00% 0.00% 0 MMN bkgrd proces
244 14813 1165414 12 0.00% 0.00% 0.00% 0 Ethchnl
245 2788 12885 216 0.00% 0.00% 0.00% 0 VMATM Callback
246 22535 214019 105 0.00% 0.00% 0.00% 0 CEF background p
247 0 1 0 0.00% 0.00% 0.00% 0 fib_fib_bfd_sb e
248 0 1 0 0.00% 0.00% 0.00% 0 IP IRDP
249 0 1 0 0.00% 0.00% 0.00% 0 CEF RF HULC Conv
250 0 3 0 0.00% 0.00% 0.00% 0 XDR background p
251 50995 105127 485 0.00% 0.00% 0.00% 0 XDR mcast
252 13602 1165414 11 0.00% 0.00% 0.00% 0 IP ACL XDR LC Ba
253 0 7 0 0.00% 0.00% 0.00% 0 XDR RP Ping Back
147 46826 187202 250 0.00% 0.00% 0.00% 0 HULC DOT1X Proce
255 9346 194241 48 0.00% 0.00% 0.00% 0 XDR RP backgroun
256 13 10 1300 0.00% 0.00% 0.00% 0 IPC LC Message H
PID Runtime(ms) Invoked uSecs 5Sec 1Min 5Min TTY Process
257 0 1 0 0.00% 0.00% 0.00% 0 XDR RP Test Back
258 0 3 0 0.00% 0.00% 0.00% 0 ADJ background
259 0 1 0 0.00% 0.00% 0.00% 0 Critical Auth
260 348 6803 51 0.00% 0.00% 0.00% 0 TCP Timer
261 91 1223 74 0.00% 0.00% 0.00% 0 TCP Protocols
262 25382 11616134 2 0.00% 0.00% 0.00% 0 Socket Timers
263 827 38922 21 0.00% 0.00% 0.00% 0 HTTP CORE
264 2600 145927 17 0.00% 0.00% 0.00% 0 Cluster L2
265 13815 1165413 11 0.00% 0.00% 0.00% 0 Cluster RARP
266 26143 1458054 17 0.00% 0.00% 0.00% 0 Cluster Base
267 506714 23232283 21 0.00% 0.00% 0.00% 0 DHCPD Receive
268 0 2 0 0.00% 0.00% 0.00% 0 Dot1x Supplicant
269 0 2 0 0.00% 0.00% 0.00% 0 Dot1x Supplicant
270 0 2 0 0.00% 0.00% 0.00% 0 Dot1x Supplicant
271 0 2 0 0.00% 0.00% 0.00% 0 Routing Topology
272 0 3 0 0.00% 0.00% 0.00% 0 Flow Exporter Ti
273 0 1 0 0.00% 0.00% 0.00% 0 RARP Input
274 0 2 0 0.00% 0.00% 0.00% 0 IP RIB Update
275 12 109 110 0.00% 0.00% 0.00% 0 HRPC hl2mcm igmp
276 0 103 0 0.00% 0.00% 0.00% 0 HRPC hl2mcm mlds
277 0 2 0 0.00% 0.00% 0.00% 0 static
278 0 2 0 0.00% 0.00% 0.00% 0 ADJ resolve proc
279 0 1 0 0.00% 0.00% 0.00% 0 IPv6 RIB Event H
280 0 1 0 0.00% 0.00% 0.00% 0 MAB Framework
281 57746 1165417 49 0.00% 0.00% 0.00% 0 QoS stats proces
282 3712 194241 19 0.00% 0.00% 0.00% 0 DHCPD Database
283 0 2 0 0.00% 0.00% 0.00% 0 REP LSL Proc
284 0 2 0 0.00% 0.00% 0.00% 0 REP BPA/EPA Proc
285 0 5 0 0.00% 0.00% 0.00% 0 SNMP Timers
286 0 1 0 0.00% 0.00% 0.00% 0 HRPC dhcp snoopi
287 0 7 0 0.00% 0.00% 0.00% 0 HULC DHCP Snoopi
288 2649 16900 156 0.00% 0.00% 0.00% 0 IGMPSN L2MCM
289 36 182 197 0.00% 0.00% 0.00% 0 IGMPSN MRD
290 1180 2962 398 0.00% 0.00% 0.00% 0 IGMPSN
291 0 1 0 0.00% 0.00% 0.00% 0 IGMPQR
292 0 3 0 0.00% 0.00% 0.00% 0 L2TRACE SERVER
184 92756 3891582 23 0.00% 0.00% 0.00% 0 Power RPS Proces
294 2445969 25713054 95 0.00% 0.04% 0.04% 0 Marvell wk-a Pow
295 3778 16897 223 0.00% 0.00% 0.00% 0 MLDSN L2MCM
296 0 1 0 0.00% 0.00% 0.00% 0 MRD
297 0 1 0 0.00% 0.00% 0.00% 0 MLD_SNOOP
298 0 2 0 0.00% 0.00% 0.00% 0 AAA Cached Serve
299 0 3 0 0.00% 0.00% 0.00% 0 Collection proce
PID Runtime(ms) Invoked uSecs 5Sec 1Min 5Min TTY Process
300 1730 6488 266 0.00% 0.00% 0.00% 0 NIST rng proc
301 0 2 0 0.00% 0.00% 0.00% 0 ENABLE AAA
302 0 3 0 0.00% 0.00% 0.00% 0 LDAP process
303 0 2 0 0.00% 0.00% 0.00% 0 LINE AAA
304 224 2803 79 0.00% 0.00% 0.00% 0 LOCAL AAA
305 0 2 0 0.00% 0.00% 0.00% 0 EPM MAIN PROCESS
306 27330 194267 140 0.00% 0.00% 0.00% 0 OBFL VOLT obfl0
307 0 2 0 0.00% 0.00% 0.00% 0 TPLUS
308 0 1 0 0.00% 0.00% 0.00% 0 Connection Mgr
309 0 2 0 0.00% 0.00% 0.00% 0 crypto engine pr
310 0 1 0 0.00% 0.00% 0.00% 0 tHUB
311 0 7 0 0.00% 0.00% 0.00% 0 CEF RP IPC Backg
312 0 1 0 0.00% 0.00% 0.00% 0 encrypt proc
313 77 4 19250 0.00% 0.00% 0.00% 0 Crypto CA
314 0 1 0 0.00% 0.00% 0.00% 0 Crypto PKI-CRL
315 0 1 0 0.00% 0.00% 0.00% 0 HRPC x_setup req
316 0 2 0 0.00% 0.00% 0.00% 0 REP Switch Helpe
317 0 1 0 0.00% 0.00% 0.00% 0 Licensing MIB pr
318 0 17 0 0.00% 0.00% 0.00% 0 VTP Trap Process
319 4090 100387 40 0.00% 0.00% 0.00% 0 ASP Process Crea
320 2142 29721 72 0.00% 0.00% 0.00% 0 AAA SEND STOP EV
321 0 1 0 0.00% 0.00% 0.00% 0 Test AAA Client
322 0 2 0 0.00% 0.00% 0.00% 0 DHCP Security He
323 4678 100617 46 0.00% 0.00% 0.00% 0 EEM ED Syslog
324 0 1 0 0.00% 0.00% 0.00% 0 Syslog Traps
325 2643 63624 41 0.00% 0.00% 0.00% 0 FEX Logger Proce
326 0 1 0 0.00% 0.00% 0.00% 0 HCD Process
327 0 1 0 0.00% 0.00% 0.00% 0 HRPC cable diagn
328 5446 38941 139 0.00% 0.00% 0.00% 0 OBFL POE obfl0
329 0 2 0 0.00% 0.00% 0.00% 0 DiagCard4/-1
330 0 1 0 0.00% 0.00% 0.00% 0 Online Diag EEM
331 4971893 54260424 91 0.00% 0.01% 0.00% 0 PM Callback
332 0 1 0 0.00% 0.00% 0.00% 0 HULC FNF
333 0 1 0 0.00% 0.00% 0.00% 0 LICENSE AGENT
334 21000 932329 22 0.00% 0.00% 0.00% 0 dhcp snooping sw
335 121102 777927 155 0.00% 0.00% 0.00% 0 OBFL I/O Buffer
336 3 23 130 0.00% 0.00% 0.00% 0 EEM Server
337 4 2 2000 0.00% 0.00% 0.00% 0 Call Home proces
338 0 2 0 0.00% 0.00% 0.00% 0 EEM Policy Direc
339 0 1 0 0.00% 0.00% 0.00% 0 DiagCard1/-1
340 0 2 0 0.00% 0.00% 0.00% 0 EEM ED Config
341 0 3 0 0.00% 0.00% 0.00% 0 EEM ED Env
342 0 3 0 0.00% 0.00% 0.00% 0 EM ED GOLD
PID Runtime(ms) Invoked uSecs 5Sec 1Min 5Min TTY Process
343 0 3 0 0.00% 0.00% 0.00% 0 EEM ED OIR
344 0 3 0 0.00% 0.00% 0.00% 0 EEM ED Test
345 7520 291979 25 0.00% 0.00% 0.00% 0 EEM ED Timer
346 48845 63623 767 0.00% 0.00% 0.00% 0 Syslog
347 0 5 0 0.00% 0.00% 0.00% 0 RBM CORE
348 11250 194243 57 0.00% 0.00% 0.00% 0 Call Home Timer
349 0 1 0 0.00% 0.00% 0.00% 0 HRPC eee request
350 15199 194242 78 0.00% 0.00% 0.00% 0 hulc_eee_monitor
351 0 2 0 0.00% 0.00% 0.00% 0 STP FAST TRANSIT
352 0 2 0 0.00% 0.00% 0.00% 0 CSRT RAPID TRANS
353 10 7 1428 0.00% 0.00% 0.00% 0 VLAN Manager
354 77 3245 23 0.00% 0.00% 0.00% 0 SSH Event handle
355 1579 1228 1285 0.00% 0.03% 0.05% 1 SSH Process
356 0 1 0 0.00% 0.00% 0.00% 0 DiagCard2/-1
357 0 1 0 0.00% 0.00% 0.00% 0 DiagCard3/-1
358 22 299 73 0.00% 0.00% 0.00% 0 Kron Process
359 4623147 18326556 252 0.00% 0.00% 0.00% 0 IP SNMP
360 433283 9163233 47 0.00% 0.00% 0.00% 0 PDU DISPATCHER
361 1763749 9240797 190 0.00% 0.00% 0.00% 0 SNMP ENGINE
362 0 2 0 0.00% 0.00% 0.00% 0 IP SNMPV6
363 0 1 0 0.00% 0.00% 0.00% 0 SNMP ConfCopyPro
364 32 11 2909 0.00% 0.00% 0.00% 0 SNMP Traps
365 850764 12060828 70 0.00% 0.00% 0.00% 0 NTP
366 1003 234 4286 0.00% 0.00% 0.00% 0 hulc cfg mgr mas
367 131798 11659 11304 0.00% 0.00% 0.00% 0 hulc running con
- Mark as New
- Bookmark
- Subscribe
- Mute
- Subscribe to RSS Feed
- Permalink
- Report Inappropriate Content
05-05-2016 07:33 AM
Its became 90% in everyday
- Mark as New
- Bookmark
- Subscribe
- Mute
- Subscribe to RSS Feed
- Permalink
- Report Inappropriate Content
05-05-2016 08:01 AM
That's a bug the HULC process getting so high , just put in Google 2960x HULC bug , this process effects multiple platforms and its on most releases as well , from other link and other poster Leo has put this version as one that may not be effected by HULC 15.0(1)SE3 , it can reach up to 30% of cpu sometimes
163 2331774448 291273722 8005 16.56% 15.85% 15.75% 0 Hulc LED Process
When you see it at 90% is this bug at the top if the list as well , the only way to fix this is to get on an IOS that's not effected by it , check as well what the interrupt is at this time and whats happening on the switch in terms of the amount of traffic being pushed through , these are user access switches so should not have like servers connected to them or you will see interrupt get high quick
Whats more concerning is the interrupt amount 26% that means your over utilizing the switch its taking more traffic than it can handle , interrupt should not go over 4%
If ports are not in use shut them down as that can bring the cpu down for HULC too and I would change the image but one thing I have noticed with this bug it usually does not effect the actual switch performance
Most 2960s cant do cef so everything will be process switched in hardware anyway but that's not going to help the cpu having a high load
- Mark as New
- Bookmark
- Subscribe
- Mute
- Subscribe to RSS Feed
- Permalink
- Report Inappropriate Content
05-05-2016 10:01 PM
If it is expected that which model is the best model where all the bug has been fix.Or which version of IOS is best to minimize the issues.
My Current Version:
Cisco IOS Software, C2960X Software (C2960X-UNIVERSALK9-M), Version 15.0(2a)EX5, RELEASE SOFTWARE (fc3)
Technical Support: http://www.cisco.com/techsupport
Copyright (c) 1986-2015 by Cisco Systems, Inc.
Compiled Mon 16-Feb-15 08:16 by prod_rel_team
ROM: Bootstrap program is C2960X boot loader
BOOTLDR: C2960X Boot Loader (C2960X-HBOOT-M) Version 15.2(2r)E1, RELEASE SOFTWAR E (fc1)
L9H-1 uptime is 19 weeks, 2 days, 17 hours, 29 minutes
System returned to ROM by power-on
System restarted at 16:50:37 IST Tue Dec 22 2015
- Mark as New
- Bookmark
- Subscribe
- Mute
- Subscribe to RSS Feed
- Permalink
- Report Inappropriate Content
05-06-2016 12:42 AM
The current recommended image for 2960x is the safe harbour version ![]()
![]() 15.2.2E4(MD)
15.2.2E4(MD) ![]()
The bug unfortunately is across most access and dist switches in 2900 and 3000 series IOS , the image your on is a not a good image its an ED ear5ly deployment image the least tested by Cisco for bugs you want to always try be on and MD release main deployment that is marked as safe harbour if possible
The other option is ask TAC to tell you exactly which IOS is not effected by HULC or check the release caveats for each image on the Cisco website before downloading , either way I would get off EX5 as its ED
- Mark as New
- Bookmark
- Subscribe
- Mute
- Subscribe to RSS Feed
- Permalink
- Report Inappropriate Content
12-24-2016 09:57 PM
We're experiencing the same problem with all of our 3800 switches. Has there been a fix for this yet? malonemark Can you advise a stable version ??
- Mark as New
- Bookmark
- Subscribe
- Mute
- Subscribe to RSS Feed
- Permalink
- Report Inappropriate Content
12-28-2016 07:05 PM
Hulc LED Process uses 6-23% CPU on Catalyst 2960/2960S/2960X 24 or 48-port switch.
Conditions:
The CPU utilization for Hulc LED Process will be in the 6-23% range for the
Catalyst 2960 series like 2960, 2960S, 2960X switch models.
For WS-C2960X-48LPS-L which is 48ports PoE 2960X switch Hulc LED Process
Could reach about 22%-23%.
The is seen in 12.2(50)SE03 or later releases.
Discover and save your favorite ideas. Come back to expert answers, step-by-step guides, recent topics, and more.
New here? Get started with these tips. How to use Community New member guide