- Cisco Community
- Technology and Support
- Networking
- Switching
- Hi,I execute debug command at
- Subscribe to RSS Feed
- Mark Topic as New
- Mark Topic as Read
- Float this Topic for Current User
- Bookmark
- Subscribe
- Mute
- Printer Friendly Page
catalyst 3750 high utilization
- Mark as New
- Bookmark
- Subscribe
- Mute
- Subscribe to RSS Feed
- Permalink
- Report Inappropriate Content
09-09-2014 02:51 AM - edited 03-07-2019 08:41 PM
Hi,
We have one Catalyst 3750 with higher CPU utilization. ( CPU utilization for five seconds: 36%/30%; one minute: 27%; five minutes: 28% ) The CPU utilization for the other Catalyst 3750 is below 10%
We execute "sh proc cpu sort | exc 0.00" many times and find process "Check heaps" with higher utilization :
switch#sh proc cpu sort
CPU utilization for five seconds: 36%/30%; one minute: 27%; five minutes: 28%
PID Runtime(ms) Invoked uSecs 5Sec 1Min 5Min TTY Process
4 1581593 71425 22143 8.94% 1.19% 0.91% 0 Check heaps
88 219985 14589 15078 0.79% 0.15% 0.12% 0 HULC Tcam Memory
207 76592 525547 145 0.15% 0.11% 0.07% 0 IP Input
289 100 315 317 0.15% 0.10% 0.02% 1 Virtual Exec
The IOS version is 122-55.SE8. Please help to give me some advise to find the higher utilization issue.
Best Regards,
- Labels:
-
Other Switching
")
- Mark as New
- Bookmark
- Subscribe
- Mute
- Subscribe to RSS Feed
- Permalink
- Report Inappropriate Content
09-12-2014 03:01 AM
i dont see any other way to tell what is causing.
take the downtime and get the capture done during the MW.
- Mark as New
- Bookmark
- Subscribe
- Mute
- Subscribe to RSS Feed
- Permalink
- Report Inappropriate Content
10-14-2014 07:19 AM
Hi,
I execute debug command at production 3750 switch, from debug result, many traffic forward by software, it cause the slow network issue. Please kindly help to analysis it.
Also I tried to change 3750G switch to 3850 switch with same configuration, the count for sw forwarding not increase rapidly and no slow network issue. Is it the platform performance issue?
Best Regards,
Jackson Ku
- Mark as New
- Bookmark
- Subscribe
- Mute
- Subscribe to RSS Feed
- Permalink
- Report Inappropriate Content
10-15-2014 06:54 PM
Hi,
Hi,
I execute debug command at production 3750 switch, from debug result, many traffic forward by software, it cause the slow network issue. Please kindly help to analysis it.
Also I tried to change 3750G switch to 3850 switch with same configuration, the count for sw forwarding not increase rapidly and no slow network issue. Is it the platform performance issue?
please kindly provide the comment. Thanks a lot.
Jackson Ku
- Mark as New
- Bookmark
- Subscribe
- Mute
- Subscribe to RSS Feed
- Permalink
- Report Inappropriate Content
09-09-2014 08:44 AM
Agree with Leo there is considered to be normal. Need not have to worry.
Anyways below are the ways which will give you an idea if in case the CPU goes high what information you need to collect and how can you troubleshoot the same.
Link below can help you in doing the TS:
http://www.cisco.com/c/en/us/td/docs/switches/lan/catalyst3750/software/troubleshooting/cpu_util.html
HTH
- Mark as New
- Bookmark
- Subscribe
- Mute
- Subscribe to RSS Feed
- Permalink
- Report Inappropriate Content
09-10-2014 01:05 AM
Dear jackson.ku,
Your CPU is getting high because of interrupt traffic, i got the same issue in our Cisco 3560 switches. May below link will help you. We resolved the issue as mentioned in the below link.
1) Kindly check the input traffic of your interfaces and see which interface is making high (abnormality in traffic size) , you may need to concentrate on that port.
https://supportforums.cisco.com/discussion/12296301/cisco-3560-switch-high-utilization-because-interrupt-traffic
Regards,
Jubair.S
")
")
- Mark as New
- Bookmark
- Subscribe
- Mute
- Subscribe to RSS Feed
- Permalink
- Report Inappropriate Content
09-09-2014 09:48 AM
Hi,
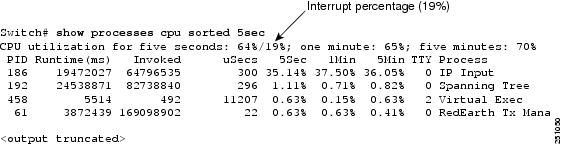
This is high CPU caused by interrupt.
CPU utilization for five seconds: 36%/30%; one minute: 27%; five minutes: 28%
share the below command output
show controllers cpu-interface // 5times interval of 30 sec, capture and upload it in text file.
Regards,
Naveen
****rate if it is Helpful****
- « Previous
-
- 1
- 2
- Next »
Discover and save your favorite ideas. Come back to expert answers, step-by-step guides, recent topics, and more.
New here? Get started with these tips. How to use Community New member guide
