- Cisco Community
- Technology and Support
- Networking
- Switching
- Uploading Slows Download Speed (and vice versa) behind Cisco 2901 NAT
- Subscribe to RSS Feed
- Mark Topic as New
- Mark Topic as Read
- Float this Topic for Current User
- Bookmark
- Subscribe
- Mute
- Printer Friendly Page
Uploading Slows Download Speed (and vice versa) behind Cisco 2901 NAT
- Mark as New
- Bookmark
- Subscribe
- Mute
- Subscribe to RSS Feed
- Permalink
- Report Inappropriate Content
07-19-2017 02:58 AM - edited 03-08-2019 11:22 AM
Hi there,
We have recently had a new leased line installed. It comes in over fiber with an NTE which converts to a 100Mb Ethernet connection (straight into the router).
We are guaranteed 100Mb up and 100Mb down from our provider.
We are running NAT on the router to provide Internet connectivity to clients private side.
We noticed that when downloading, we can achieve full throughput as this example shows:
The same is vice-versa; when we upload (without running a parallel download) we can obtain full throughput for the upload.
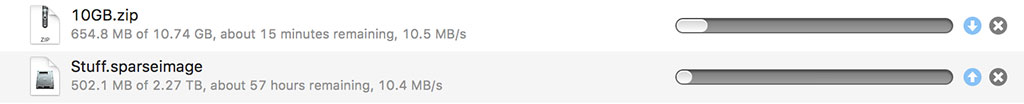
However, when we run both at the same time (upload and download) we notice that throughput is limited (for both).
See an example of an upload with a parallel download taking place: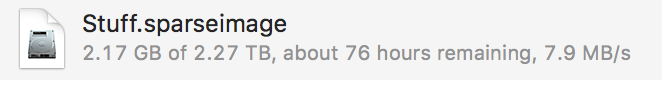
... notice the decreased throughput.
We checked the CPU on the router and it's running at about 58% with both upload/download threads running at the same time. I don't think CPU is the issue here.
Perhaps it's simply the overheads of TCP/IP?
The inside interface (connected to our switch) is running at 1Gbps / full duplex.
The outside interface (connected to the NTE) is running at 100Mbps / full duplex.
Here is some of our configuration:
NAT/Routing
ip nat inside source list 100 interface GigabitEthernet0/1 overload
ip nat inside source static tcp 192.168.0.160 51413 interface GigabitEthernet0/1 51413
ip nat inside source static 192.168.0.210 x.x.x.x
ip nat inside source static 192.168.0.250 x.x.x.x
ip route 0.0.0.0 0.0.0.0 x.x.x.x
Interface
interface GigabitEthernet0/0
ip address 192.168.0.1 255.255.255.0
ip nat inside
ip virtual-reassembly in
duplex auto
speed auto
no mop enabled

interface GigabitEthernet0/1
ip address x.x.x.x 255.255.255.248
ip nat outside
ip virtual-reassembly in
duplex auto
speed auto
We are also running CEF
ip cef
Thoughts around queueing
Perhaps running some kind of fair-queue on the interface will improve throughout but I was under the impressions that it was for slower links that have trouble like this. I am also under that impression that it uses lots of CPU.
Currently, both interfaces are running default FIFO.
Any thoughts, suggestions,
- Labels:
-
Other Switching
- Mark as New
- Bookmark
- Subscribe
- Mute
- Subscribe to RSS Feed
- Permalink
- Report Inappropriate Content
07-20-2017 03:14 AM
Off the top of my head, interface command hold-queue output #.
The command we used on the external int (Gi/01) was:
hold-queue 256 out
We cleared counters and ran an up/down test to max out the connection:
Total output drops: 148
Output queue: 388/512 (size/max)
We are still getting output drops (as above) - these stats were just after clearing counters.
- Mark as New
- Bookmark
- Subscribe
- Mute
- Subscribe to RSS Feed
- Permalink
- Report Inappropriate Content
07-20-2017 05:26 AM
Since applying the hold-queue, I have noticed:
When running an upload/download on separate machines, I can get ~11MB/s upload and the download stays 5-7MB/s.
If I start the upload first, the download starts very slow and works its way up to around 5-7MB/s very slowly (over 1 minute) but it fluctuates between 5-7MB/s over the course of the test - constantly up and down. The upload stays consistent at 11MB/s. I don't know if this indicates anything (FIFO).
As soon as I cancel the upload, the download works its way up to ~11MB/s pretty quickly.
- Mark as New
- Bookmark
- Subscribe
- Mute
- Subscribe to RSS Feed
- Permalink
- Report Inappropriate Content
07-20-2017 07:52 AM
That might be the download, if TCP, is waiting on its ACKs.
Try:
policy-map CBWFQ_test
class class-default
fair-queue
interface g0/1
service-policy ouput CBWFQ_test
You may need to add a queue-length(?) command to the above class class-default to insure there's a larger egress queue. The default might only be 64.
- Mark as New
- Bookmark
- Subscribe
- Mute
- Subscribe to RSS Feed
- Permalink
- Report Inappropriate Content
07-20-2017 09:23 AM
We've applied the fair-queue. We seem to be getting somewhere:
Up/down speeds are pretty much equal now. The fair-queue seems to be prioritizing the ACKs. CPU has gone up to about 70-80% by using fair-queue while running both up/down threads.
You mentioned queue-length, I think you meant queue-limit. We used:
policy-map CBWFQ_test
 class class-default
 fair-queue
 queue-limit 1024 packets
Is this an acceptable limit? What should I be checking to make sure?
Do you know of any other tweaks to try to achieve maximum throughput? When we are not uploading, we can get about 11MB/s down and vice-versa. In an ideal world, we'd like to achieve this for both uploading/downloading at the same time.
It's puzzling as to why we have to use fair-queue with a setup like this? I remember using it on old DSL lines with ring-limit... etc.
Thank you for your help Joseph, it's much appreciated.
- Mark as New
- Bookmark
- Subscribe
- Mute
- Subscribe to RSS Feed
- Permalink
- Report Inappropriate Content
07-20-2017 11:04 AM
You mentioned queue-length, I think you meant queue-limit.
Yep, that's why I had the question mark - I wasn't sure of the actual command. Many (usually earlier/older CBWFQ) implementations don't support that command.
Is this an acceptable limit? What should I be checking to make sure?
Watch for drops. Adjust as needed. Show policy interface will provide stats.
BTW, depending on the CBWFQ implementation, there may also be a command to adjust per-flow queue lengths. Some (?) implementations might also have a command to vary number of flow queues (usually that's auto determined by overall bandwidth).
Do you know of any other tweaks to try to achieve maximum throughput?
Possibly, but also possibly for diminishing results.
When we are not uploading, we can get about 11MB/s down and vice-versa. In an ideal world, we'd like to achieve this for both uploading/downloading at the same time.
Laugh - your last posting show about 10.5 MB/s for both up and down. Considering that's about 95% of an 11 MB/s unidirectional rate, although now for concurrent up/down, and your CPU is pushing up against 80%, I think that's pretty good.
It's puzzling as to why we have to use fair-queue with a setup like this? I remember using it on old DSL lines with ring-limit... etc.
I explained earlier, when I suggested trying it. But as to using it vs. slower links, congestion is congestion. When you have congestion, often the issues caused by it, and some of the solutions, don't really vary because the link has different bandwidth.
Just for some other interesting tests, try running your host with its NIC set to 100 Mbps.
- Mark as New
- Bookmark
- Subscribe
- Mute
- Subscribe to RSS Feed
- Permalink
- Report Inappropriate Content
07-20-2017 06:19 AM
Also, I have noticed since applying the hold-queue config, the upload is getting the increased bandwidth now instead of the download when running in parallel. It was the opposite before we applied this config - the download always had the faster speeds when running in parallel.
- Mark as New
- Bookmark
- Subscribe
- Mute
- Subscribe to RSS Feed
- Permalink
- Report Inappropriate Content
07-20-2017 06:26 AM
That would imply the prior egress queue depth was effectively throttling your upload and also might imply insufficient buffering in upstream device(s) for download.
- Mark as New
- Bookmark
- Subscribe
- Mute
- Subscribe to RSS Feed
- Permalink
- Report Inappropriate Content
07-20-2017 06:25 AM
Increasing the egress queue may not eliminate all drops, what you're looking to see is if increasing the queue size drops the percentage of drops and/or increases the transfer rate.
Interestingly, you noted having set queue size to 256, but your stats show a queue max size of 512.(?)
Also interesting of your posted stats, it shows current queue depth of 388. That's quite a bit more than the default allowance of 40.
- Mark as New
- Bookmark
- Subscribe
- Mute
- Subscribe to RSS Feed
- Permalink
- Report Inappropriate Content
07-20-2017 06:29 AM
Interestingly, you noted having set queue size to 256, but your stats show a queue max size of 512.(?)
We upped the queue size to 512 when we noticed the depth of 256 was filling up.
You're right, we captured 388 which is of course higher. Thanks for your help.
- Mark as New
- Bookmark
- Subscribe
- Mute
- Subscribe to RSS Feed
- Permalink
- Report Inappropriate Content
07-20-2017 08:02 AM
BTW, 94 or so Mbps, might have the 100 Mbps link running as about as fast as you might normally obtain. Unless you tune host TCP RWINs, TCP will overrun the available bandwidth and back off. When it does this, its average transfer rate tends to be under the maximum possible.
Also with the above, the above stats might not be allowing/accounting for L2 or L3 overhead in the transfer rate. I.e. you'll often never "see" a 100 Mbps transfer rate.
Oh, and as I noted in another of my posts, if one direction's high transfer rate is slowing the other direction's transfer rate due to FIFO delaying TCP ACKs, you might be stuck with whatever your provider is doing for your downstream.
")
")
- Mark as New
- Bookmark
- Subscribe
- Mute
- Subscribe to RSS Feed
- Permalink
- Report Inappropriate Content
07-20-2017 10:52 AM
Most important rule regarding duplex auto negotiation.
| LAN 1 | LAN 2 | Result 1 | Result 2 |
| duplex full | duplex auto | duplex full | duplex a-half |
End result is duplex mismatch and collisions will occur. So, configure both sides to match.
General Troubleshooting for 10/100/1000 Mbps NICs
I like chapter - NIC Compatibility and Operation Issues - on the same page. In any case, something can go wrong.
- Mark as New
- Bookmark
- Subscribe
- Mute
- Subscribe to RSS Feed
- Permalink
- Report Inappropriate Content
07-20-2017 03:25 AM
Yes, another stat I would like to see.
Here is the output of sh buffers:
Buffer elements:
 1629 in free list
 20572141 hits, 0 misses, 2268 created

Public buffer pools:
Small buffers, 104 bytes (total 59, permanent 50, peak 59 @ 00:35:32):
 56 in free list (20 min, 150 max allowed)
 5765 hits, 3 misses, 0 trims, 9 created
 0 failures (0 no memory)
Middle buffers, 600 bytes (total 40, permanent 25, peak 40 @ 00:35:32):
 38 in free list (10 min, 150 max allowed)
 3113 hits, 5 misses, 0 trims, 15 created
 0 failures (0 no memory)
Big buffers, 1536 bytes (total 51, permanent 50, peak 51 @ 00:35:42):
 51 in free list (5 min, 150 max allowed)
 156 hits, 0 misses, 0 trims, 1 created
 0 failures (0 no memory)
VeryBig buffers, 4520 bytes (total 11, permanent 10, peak 11 @ 00:35:42):
 11 in free list (0 min, 100 max allowed)
 0 hits, 0 misses, 0 trims, 1 created
 0 failures (0 no memory)
Large buffers, 5024 bytes (total 1, permanent 0, peak 1 @ 00:36:01):
 1 in free list (0 min, 10 max allowed)
 0 hits, 0 misses, 0 trims, 1 created
 0 failures (0 no memory)
Huge buffers, 18024 bytes (total 5, permanent 0, peak 5 @ 00:35:42):
 5 in free list (4 min, 10 max allowed)
 0 hits, 0 misses, 0 trims, 5 created
 0 failures (0 no memory)

Interface buffer pools:
CF Small buffers, 104 bytes (total 101, permanent 100, peak 101 @ 00:35:55):
 101 in free list (100 min, 200 max allowed)
 0 hits, 0 misses, 0 trims, 1 created
 0 failures (0 no memory)
Generic ED Pool buffers, 512 bytes (total 101, permanent 100, peak 101 @ 00:35:38):
 101 in free list (100 min, 100 max allowed)
 0 hits, 0 misses
CF Middle buffers, 600 bytes (total 101, permanent 100, peak 101 @ 00:35:55):
 101 in free list (100 min, 200 max allowed)
 0 hits, 0 misses, 0 trims, 1 created
 0 failures (0 no memory)
Syslog ED Pool buffers, 600 bytes (total 133, permanent 132, peak 133 @ 00:35:38):
 115 in free list (132 min, 132 max allowed)
 23 hits, 0 misses
CF Big buffers, 1536 bytes (total 26, permanent 25, peak 26 @ 00:35:55):
 26 in free list (25 min, 50 max allowed)
 0 hits, 0 misses, 0 trims, 1 created
 0 failures (0 no memory)
IPC buffers, 4096 bytes (total 2, permanent 2):
 1 in free list (1 min, 8 max allowed)
 1 hits, 0 fallbacks, 0 trims, 0 created
 0 failures (0 no memory)
CF VeryBig buffers, 4520 bytes (total 3, permanent 2, peak 3 @ 00:35:55):
 3 in free list (2 min, 4 max allowed)
 0 hits, 0 misses, 0 trims, 1 created
 0 failures (0 no memory)
CF Large buffers, 5024 bytes (total 2, permanent 1, peak 2 @ 00:35:55):
 2 in free list (1 min, 2 max allowed)
 0 hits, 0 misses, 0 trims, 1 created
 0 failures (0 no memory)
IPC Medium buffers, 16384 bytes (total 2, permanent 2):
 2 in free list (1 min, 8 max allowed)
 0 hits, 0 fallbacks, 0 trims, 0 created
 0 failures (0 no memory)
IPC Large buffers, 65535 bytes (total 17, permanent 16, peak 17 @ 00:35:57):
 17 in free list (16 min, 16 max allowed)
 0 hits, 0 misses, 35 trims, 36 created
 0 failures (0 no memory)

Header pools:
Header buffers, 0 bytes (total 768, permanent 768):
 256 in free list (128 min, 1024 max allowed)
 553 hits, 0 misses, 0 trims, 0 created
 0 failures (0 no memory)
 512 max cache size, 512 in cache
 3576504 hits in cache, 41 misses in cache

Particle Clones:
 1024 clones, 0 hits, 0 misses

Public particle pools:
F/S buffers, 1664 bytes (total 768, permanent 768):
 256 in free list (128 min, 1024 max allowed)
 512 hits, 0 misses, 0 trims, 0 created
 0 failures (0 no memory)
 512 max cache size, 512 in cache
 0 hits in cache, 0 misses in cache
Normal buffers, 1676 bytes (total 3840, permanent 3840):
 3840 in free list (128 min, 4096 max allowed)
 0 hits, 0 misses, 0 trims, 0 created
 0 failures (0 no memory)

Private particle pools:
HQF Particle buffers, 0 bytes (total 2000, permanent 2000):
 2000 in free list (500 min, 2000 max allowed)
 0 hits, 0 misses, 0 trims, 0 created
 0 failures (0 no memory)
IDS SM buffers, 240 bytes (total 128, permanent 128):
 0 in free list (0 min, 128 max allowed)
 128 hits, 0 fallbacks
 128 max cache size, 128 in cache
 0 hits in cache, 0 misses in cache
GigabitEthernet0/0 buffers, 1664 bytes (total 1024, permanent 1024):
 0 in free list (0 min, 1024 max allowed)
 1024 hits, 0 fallbacks
 1024 max cache size, 768 in cache
 4831586 hits in cache, 0 misses in cache
GigabitEthernet0/1 buffers, 1664 bytes (total 1024, permanent 1024):
 0 in free list (0 min, 1024 max allowed)
 1024 hits, 0 fallbacks
 1024 max cache size, 768 in cache
 6020384 hits in cache, 0 misses in cache
- Mark as New
- Bookmark
- Subscribe
- Mute
- Subscribe to RSS Feed
- Permalink
- Report Inappropriate Content
07-20-2017 06:15 AM
Nothing in the buffer stats catches my attention as being "bad".
- Mark as New
- Bookmark
- Subscribe
- Mute
- Subscribe to RSS Feed
- Permalink
- Report Inappropriate Content
07-21-2017 01:01 AM
As a test, we have just replaced our Cisco 2901 with a
When downloading exclusively, we can attain 11MB/s down. However, when we run an upload thread at the same time as
- Mark as New
- Bookmark
- Subscribe
- Mute
- Subscribe to RSS Feed
- Permalink
- Report Inappropriate Content
07-21-2017 01:21 AM
Ryan,
time to put the heat on your ISP I guess...
Discover and save your favorite ideas. Come back to expert answers, step-by-step guides, recent topics, and more.
New here? Get started with these tips. How to use Community New member guide
