- Cisco Community
- Technology and Support
- Data Center and Cloud
- UCS Director
- UCS Director Discussions
- Re: UCSD - Vmware Performance metrics suddenly stopped
- Subscribe to RSS Feed
- Mark Topic as New
- Mark Topic as Read
- Float this Topic for Current User
- Bookmark
- Subscribe
- Mute
- Printer Friendly Page
- Mark as New
- Bookmark
- Subscribe
- Mute
- Subscribe to RSS Feed
- Permalink
- Report Inappropriate Content
04-27-2018 06:10 AM - edited 03-01-2019 06:27 AM
Hi,
Since a few days, UCSD is unable to read the performance metrics from VMWare.
I enabled debug logging and found following error in the log (repeating for each VM). Any hints to where I should start troubleshooting?
2018-04-27 12:59:01,244 [Thread-321] DEBUG fromXML(XmlGenDom.java:77) - Parsing XML payload from server. Calendar
2018-04-27 12:59:01,245 [Thread-321] DEBUG collectDataForVM(PerfDataCollector.java:392) - Collecting VM level perf data vmId=1049, vmname=V55555
2018-04-27 12:59:01,245 [Thread-321] DEBUG retrieveObjectContents(InventoryNavigator.java:83) - API version >= 4 detected. Using buildFullTraversalV4.
2018-04-27 12:59:01,272 [Thread-321] DEBUG fromXML(XmlGenDom.java:77) - Parsing XML payload from server. ObjectContent[]
2018-04-27 12:59:01,280 [Thread-321] DEBUG query(JDBCObjStore.java:195) - Query table --> limit -1 offset -1
2018-04-27 12:59:01,280 [Thread-321] DEBUG query(JDBCObjStore.java:204) - Executing query (MySQL)
2018-04-27 12:59:01,280 [Thread-321] DEBUG parseJDOQL(JDBCObjStore.java:816) - Incase of SQLInjection Excpetion below, query executed by POJO:class com.cloupia.service.cIM.inframgr.PollingState
2018-04-27 12:59:01,280 [Thread-321] DEBUG convertToJDBCQuery(QueryParser.java:106) - jdoQuery cloudName == 'Cloud' && contextValue =='1049' && contextType == 3
2018-04-27 12:59:01,280 [Thread-321] DEBUG query(JDBCObjStore.java:229) - Executing query SELECT * FROM POLLING_STATE A WHERE cloudName = 'Cloud' AND contextValue ='1049' AND contextType = 3
2018-04-27 12:59:01,281 [Thread-321] DEBUG query(JDBCObjStore.java:258) - Query result 0 rows, time =1 ms
2018-04-27 12:59:01,287 [Thread-321] DEBUG getInputStreamFromConnection(WSClient.java:201) - Caught an IOException. Reading ErrorStream for results.
java.io.IOException: Server returned HTTP response code: 500 for URL: https://vcenter.dns/sdk
at sun.net.www.protocol.http.HttpURLConnection.getInputStream0(HttpURLConnection.java:1876)
at sun.net.www.protocol.http.HttpURLConnection.access$200(HttpURLConnection.java:91)
at sun.net.www.protocol.http.HttpURLConnection$9.run(HttpURLConnection.java:1466)
at sun.net.www.protocol.http.HttpURLConnection$9.run(HttpURLConnection.java:1464)
at java.security.AccessController.doPrivileged(Native Method)
at java.security.AccessController.doPrivilegedWithCombiner(AccessController.java:782)
at sun.net.www.protocol.http.HttpURLConnection.getInputStream(HttpURLConnection.java:1463)
at sun.net.www.protocol.https.HttpsURLConnectionImpl.getInputStream(HttpsURLConnectionImpl.java:254)
at com.vmware.vim25.ws.WSClient.getInputStreamFromConnection(WSClient.java:197)
at com.vmware.vim25.ws.WSClient.post(WSClient.java:184)
at com.vmware.vim25.ws.WSClient.invoke(WSClient.java:104)
at com.vmware.vim25.ws.VimStub.queryPerf(VimStub.java:1451)
at com.cloupia.lib.cIaaS.vmware.perf.PerfDataCollector.collectDataForVM(PerfDataCollector.java:539)
at com.cloupia.lib.cIaaS.vmware.VCenterDriver.collectMonitoringData(VCenterDriver.java:17630)
at com.cloupia.service.cIM.inframgr.vmware.VMWareController.collectMonitoringData(VMWareController.java:830)
at com.cloupia.service.cIM.inframgr.PerfDataCollectorTask.execute(PerfDataCollectorTask.java:183)
at com.cloupia.fw.scheduler.SystemTaskExecutor.executeLocally(SystemTaskExecutor.java:161)
at com.cloupia.fw.scheduler.SystemTaskExecutor.run(SystemTaskExecutor.java:118)
at com.cloupia.fw.scheduler.SystemTaskScheduler$1.run(SystemTaskScheduler.java:178)
Solved! Go to Solution.
- Labels:
-
Troubleshooting
-
UCS Director
Accepted Solutions
- Mark as New
- Bookmark
- Subscribe
- Mute
- Subscribe to RSS Feed
- Permalink
- Report Inappropriate Content
04-30-2018 02:36 AM
FIXED!
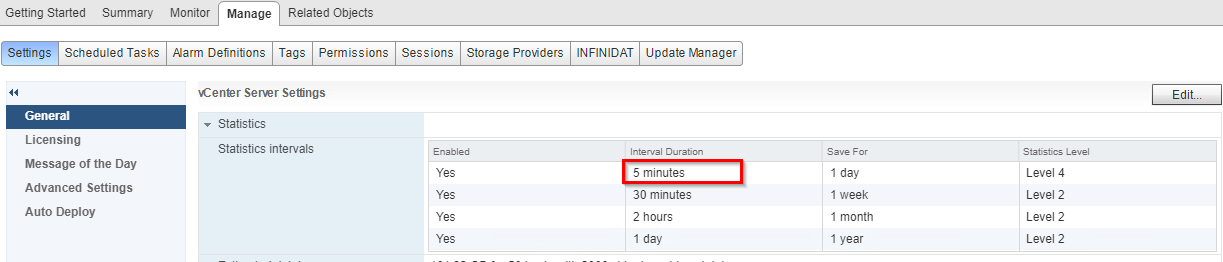
On Vcenter, monitoring statistics interval had been modified from the default 5 minutes, to 1 minute (in addition to the statistics level).
Apparently, the interval duration is the argument, that generated the errors during the queries of the performance statistics. We modified it back to 5 minutes, and the statistics started working again.
- Mark as New
- Bookmark
- Subscribe
- Mute
- Subscribe to RSS Feed
- Permalink
- Report Inappropriate Content
04-27-2018 06:14 AM
Did the version of vCenter change?
Is your version of UCSD compatible with the version of vCenter?
https://www.cisco.com/c/en/us/support/servers-unified-computing/ucs-director/products-device-support-tables-list.html
- Mark as New
- Bookmark
- Subscribe
- Mute
- Subscribe to RSS Feed
- Permalink
- Report Inappropriate Content
04-27-2018 06:20 AM
Nothing has changed. We are running UCSD 6.5.0.1, and vCenter Server 6.0 Update 3
- Mark as New
- Bookmark
- Subscribe
- Mute
- Subscribe to RSS Feed
- Permalink
- Report Inappropriate Content
04-27-2018 06:26 AM
Disk full?
https://communities.cisco.com/docs/DOC-69965
Anything change here?
Administration -> System -> Advanced Controls (Collecting details and statistics)
Administration -> System -> Infrastructure System Parameters
Administration -> System -> System Parameters
Administration -> System -> System Tasks (Local?)
Administration -> User Interface Settings -> Reports Customization (turn on/off screens)
Policies -> Service Delivery -> Data Collection Policy / Data Collection Policy Association
Granular Metrics on CPU/Memory/Disk/Datastore
- Mark as New
- Bookmark
- Subscribe
- Mute
- Subscribe to RSS Feed
- Permalink
- Report Inappropriate Content
04-27-2018 06:34 AM
I already checked the disks on the console, and there is still enough free space...:
Volume Mounted on Size Used Available %Use Usage
--------------------- ------------- ------- -------- --------- ------ -------------
/dev/sda3 / 97G 46G 46G 50% NORMAL
/dev/sda1 /boot 194M 39M 146M 21% NORMAL
infradb_vg-infradb_lv /infradb 99G 8.8G 90G 9% NORMAL
The other settings look OK to me...
- Mark as New
- Bookmark
- Subscribe
- Mute
- Subscribe to RSS Feed
- Permalink
- Report Inappropriate Content
04-27-2018 06:34 AM
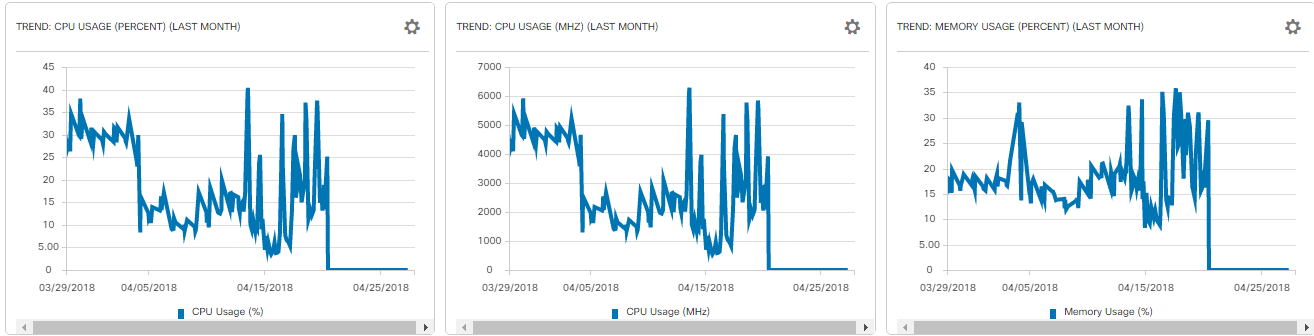
This is what we see:
- Mark as New
- Bookmark
- Subscribe
- Mute
- Subscribe to RSS Feed
- Permalink
- Report Inappropriate Content
04-27-2018 06:40 AM
If I were a betting man I’d say the BU put in a 10% hurdle in there some where to stop collecting performance data to keep the DB for actual workflow action going….
- Mark as New
- Bookmark
- Subscribe
- Mute
- Subscribe to RSS Feed
- Permalink
- Report Inappropriate Content
04-27-2018 06:37 AM
Whow – your DB is almost full.
How any SR_ID’s do you have? Have you ever archived and deleted SR’s?
- Mark as New
- Bookmark
- Subscribe
- Mute
- Subscribe to RSS Feed
- Permalink
- Report Inappropriate Content
04-27-2018 06:41 AM
We have archived some SR's, but currently, we are at SR_ID:7265, so that doesn't look that high, does it?
I''l start archiving and deleting some old SR's, to see if the space goes down...
- Mark as New
- Bookmark
- Subscribe
- Mute
- Subscribe to RSS Feed
- Permalink
- Report Inappropriate Content
04-27-2018 06:49 AM
So I run my UCSD with keeping data only for 7 days or so. I need it to automate and orchestrate stuff for me. Monitoring and pretty graphs are secondary/trishary for me.
As to the SR’s – well depends how big the workflow was and if it had loops in it? Hence the amount of data per SR depends just how much the WF did.
My system does a tone of stuff and my DB is here:
/dev/mapper/infradb_vg-infradb_lv
99G 5.2G 94G 6% /infradb
but like I said I don’t collect a lot of data. I need speed (GUI speed) and my WF’s better work and do things for me while I sleep ☺
you will have to run some Purge system tasks to see things with in an hour or so. Other wise you will see results of new system parameters tomorrow (24h). Most purge task run every 24 hours.
- Mark as New
- Bookmark
- Subscribe
- Mute
- Subscribe to RSS Feed
- Permalink
- Report Inappropriate Content
04-29-2018 10:49 PM
DB usage isn't that high... it's just the columns that aren't alligned nicely... 9% used...
Volume Mounted on Size Used Available %Use Usage
--------------------- ------------- ------- -------- --------- ------ -------------
/dev/sda3 / 97G 46G 46G 0% NORMAL
/dev/sda1 /boot 194M 39M 146M 21% NORMAL
infradb_vg-infradb_lv /infradb 99G 8.9G 90G 9% NORMAL
- Mark as New
- Bookmark
- Subscribe
- Mute
- Subscribe to RSS Feed
- Permalink
- Report Inappropriate Content
04-29-2018 11:12 PM
In my log, I still see following errors/warnings:
2018-04-30 06:05:03,058 [pool-47-thread-3] ERROR invoke(WSClient.java:109) - Exception caught while invoking method: QueryAvailablePerfMetric
com.vmware.vim25.InvalidArgument: A specified parameter was not correct: interval
2018-04-30 06:05:03,061 [pool-47-thread-3] WARN collectMonitoringData(VCenterDriver.java:17670) - Error while collecting perf data for hostnode Cloud/esx01.local.dns
com.vmware.vim25.InvalidArgument: A specified parameter was not correct: interval
- Mark as New
- Bookmark
- Subscribe
- Mute
- Subscribe to RSS Feed
- Permalink
- Report Inappropriate Content
04-30-2018 02:36 AM
FIXED!
On Vcenter, monitoring statistics interval had been modified from the default 5 minutes, to 1 minute (in addition to the statistics level).
Apparently, the interval duration is the argument, that generated the errors during the queries of the performance statistics. We modified it back to 5 minutes, and the statistics started working again.
- Mark as New
- Bookmark
- Subscribe
- Mute
- Subscribe to RSS Feed
- Permalink
- Report Inappropriate Content
04-30-2018 05:02 AM
This interval change was done in UCSD or on vCenter?
- Mark as New
- Bookmark
- Subscribe
- Mute
- Subscribe to RSS Feed
- Permalink
- Report Inappropriate Content
05-01-2018 11:41 PM
It was modified on VMWare level... Don't know where I could change it in UCSD... 
Discover and save your favorite ideas. Come back to expert answers, step-by-step guides, recent topics, and more.
New here? Get started with these tips. How to use Community New member guide