- Cisco Community
- Technology and Support
- Data Center and Cloud
- Unified Computing System (UCS)
- Unified Computing System Knowledge Base
- Cisco UCS Monitoring Resource Handbook
- Subscribe to RSS Feed
- Mark as New
- Mark as Read
- Bookmark
- Subscribe
- Printer Friendly Page
- Report Inappropriate Content
- Subscribe to RSS Feed
- Mark as New
- Mark as Read
- Bookmark
- Subscribe
- Printer Friendly Page
- Report Inappropriate Content
on
11-11-2013
10:08 PM
- edited on
05-20-2020
09:21 AM
by
Greg Wilkinson
![]()
Cisco UCS Monitoring Resource Handbook
Authored by Eric Williams, Jeff Foster, and Jason Shaw
This document is intended to be a central repository of monitoring resources and recommendations for Cisco UCS Manager and the Cisco Standalone C-Series Servers. This content is intended to supplement the ‘Demystifying Monitoring for UCS Manager & C-Series’ Tech Talk available here:
https://communities.cisco.com/docs/DOC-37138
Additional Cisco Monitoring Resources: (Cited within this document)
- UCS Manager MIB Reference Guide
- UCS Manager Fault Reference Guide
- C-Series MIB Reference Guide:
- C-Series Fault Reference Guide:
- Monitoring UCS Manager with Syslog:
UCSM and Standalone C-Series Monitoring Overview:
UCS Manager Monitoring Background:
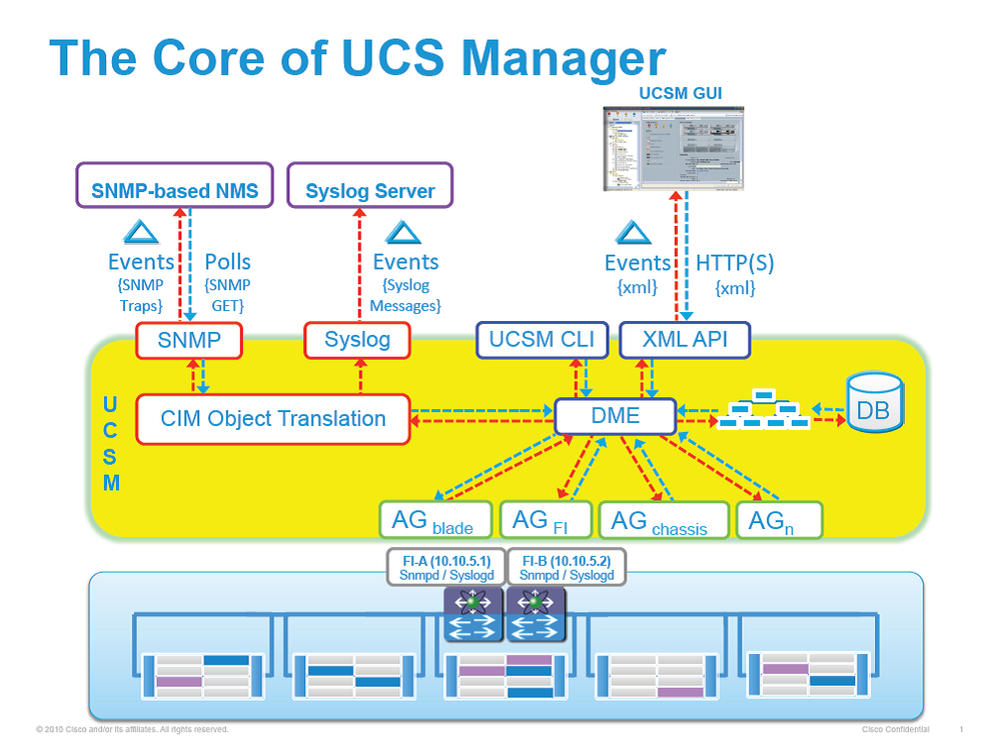
The core of UCS Manager is made up three core elements, which are the Data Management Engine (DME), Application Gateway (AG), and user accessible northbound interface (SNMP, Syslog, XMLAPI and UCS CLI). With UCS Manager there are three main ways of monitoring UCS servers, which are XML API, SNMP, and syslog. Both SNMP and Syslog are interfaces only used for monitoring as they are “read-only” in nature, not allowing an end user to change the configuration. Alternatively, the UCS XML API is a monitoring that is “read-write” in nature, which does allow an end user to both monitor UCS, as well as change the configuration if needed.
Data Management Engine (DME) - The DME is the center of the UCS Manager universe, or the “queen bee” of the entire system. It is the maintainer of the UCS XML database which houses the inventory database of all physical elements (blade / rack mount servers, chassis, IO modules, fabric interconnects, etc.), the logical configuration data for profiles, policies, pools, vNIC / vHBA templates, and the various networking related configuration details (VLANs, VSANs, port channels, network uplinks, server downlinks, etc). It maintains the current health and state of all components of all physical and logical elements in a UCS Domain, and maintains the transition information of all Finite State Machine (FSM) tasks occurring. The inventory, health, and configuration data of managed end points stored in the UCS XML Database are always showing current data, delivered in near real time. As fault conditions are raised and cleared on end points, the DME will create, clear, and remove faults in the UCS XML database as those fault conditions are raised or mitigated. The faults stored in the UCS XML database only are the ones actively occurring, as the DME by default does not store a historical log of all faults that have occurred on a UCS Domain.
Application Gateway (AG) - The AG’s are the software agents, or “worker bees”, that communicate directly with the end points to provide the health and state of the end points to the DME. AG’s manage configuration changes from the current state to the desired state during FSM transitions when changes are made to the UCS XML database. AG managed end points include servers, chassis, IO Modules, fabric extenders, fabric interconnects, and NXOS. The server AG’s actively monitor the server through the IPMI and SEL logs via the Cisco Integrated Management Controller (CIMC) to provide the DME with the health, state, configuration, and potential fault conditions of a device. The IO Module AG and chassis AG communicate with the Chassis Management Controller (CMC) to get information about the health, state, configuration, and fault conditions visible by the CMC. The fabric interconnect / NXOS AG communicates directly with NXOS to get information about the health, state, configuration, statistics, and fault conditions visible by NXOS on the fabric interconnects. All AG’s provide the inventory details to DME about end point during the various discovery processes. The AG’s perform the state changes necessary to configure an end point during FSM triggered transitions, monitors the health and state of the end points, and notifies the DME of any faults or conditions.
Northbound interfaces - The northbound interfaces include SNMP, Syslog, CLI and XML API. The XML API present in the Apache webserver layer used to send login, logout, query, and configuration requests via HTTP or HTTPS. SNMP and Syslog are both consumers of data from the DME. SNMP informs and traps are translated directly from the fault information stored in the UCS XML database. Inversely, SNMP GET requests are sent through the same object translation engine in reverse, where the DME receives a request from the object translation engine and the data is translated from XML data from the DME to a SNMP response. Syslog messages use the same object translation engine as SNMP, where the source of the data (faults, events, audit logs) is translated from XML into a UCS Manager formatted syslog message.
Standalone C-Series Monitoring Background:
Monitoring support for our Standalone C-Series Servers has evolved with each release. The features and capabilities of the current CIMC release, v1.5 supports our M3 Platforms including the C220 M3, C240 M3, C22 M3, C24 M3 and C420 M3 as well as our C260 M2 and C460 M2. While earlier versions of our CIMC supported Syslog and SNMP, the Fault Engine added support for SNMP v3 in CIMC v1.5. We have documented the internals of our monitoring subsystem in the graphic included below.
Fault Engine Overview:
While Cisco Standalone C-Series Servers do not support the DME/AG architecture described above in the UCS Manager section, many of the same concepts can be applied to the monitoring subsystem for Standalone Servers. The Fault Engine has become a central repository and clearinghouse for fault data as it is passed along to monitoring endpoints. The Fault engine acts as a master repository for events within the system which initiates alerts (SNMP Traps, Syslog messages, XML API events, etc.) but can also be queried via SNMP (GETs) or the XML API. This durability of fault information means provides customers a mechanism to not only receive fault data, but also use these interfaces to query system health data.
Within the system, the Fault Engine regularly polls component health status in the form of sensor data using IPMI and the Storage Daemon and these values are compared to threshold reference points. If a sensor value is outside one of the threshold values, an entry is created in the fault engine and notifications are sent as appropriate. As discussed earlier, multiple notification types are supported including SNMP (Traps and Informs), Syslog (Messages) and XML API (Event Subscription) and fault queries are supported through SNMP GET and XML API queries. Cisco has developed a number of integrations for 3rd Party Management solutions that leverage queries of the Fault Engine data to drive notifications in these management tools. The Fault Engine retains faults until they are mitigated or until the IMC is rebooted.
UCS Manager Best Practices:
The recommendation for monitoring a UCS Manager environment would be to monitor all faults of either severity critical or major and that are not of type “FSM”. FSM related faults are transient in nature, as they are triggered when a FSM transition is occurring in UCS Manager. Generally speaking, FSM related faults will resolve themselves automatically as most are triggered after a task fails the first time, but will be successful on a subsequent try. An example of a FSM task failure would be when a FSM task waiting for a server to finish BIOS POST fails during a service profile association. This particular condition can happen when a server with many memory DIMMs takes longer to successfully finish POST than the default timeout of the FSM task. This timeout would raise a FSM fault on this task, but by default would keep retrying up to the defined FSM task retry limit. If a subsequent retry is successful, the FSM task fault raised will be cleared and removed. However, if subsequent retries are unsuccessful and the retry limit is hit, the FSM task will be faulted and another fault will be raised against the affected object. In this example, a configuration failure would be raised against the service profile, as the association process would have failed because the server did not perform a successful BIOS POST.
If you are looking for a list of the most critical faults codes to monitor, refer to the “Syslog Messages to Monitor” section in Chapter 3 of the “Monitoring UCS Manager with Syslog” guide below. The fault codes listed are the same codes for all interfaces (SNMP, syslog, or XML API).
C-Series Standalone Best Practices:
Filtering: As referenced above, the faults for our Standalone C-Series Servers are consistent with faults for UCS Manager. The concept of FSM (Finite State Machine) does not exist with Standalone C-Series, there is no reason to filter out FSM State changes when monitoring these systems. The recommendation is that filters not be applied to Standalone C-Series Servers as all raised faults are relevant to customers who are interested in monitoring/alerting capabilities. At present, there are approximately 85 faults that are included in the Fault Database for our Standalone C-Series Servers with CIMC 1.5(3).
SNMP vs. Platform Event Filters (PEF): As monitoring has evolved in these systems, support has been extended to include a number of notification mechanisms, and Cisco is planning to deprecate Platform Event Filters (PEF) and Platform Event Traps (PET) in a future CIMC release. Platform Event Traps are sent as IPMI v1 traps where filters (PEF) can be applied so only certain subsystem traps are sent to the NMS system. The variable bindings that are consistent across UCS Manager and Standalone C-Series servers do not apply to Platform Event Filters as they have their own nomenclature that is defined and maintained by Intel.
XML API Usage: As a more robust XML API has been implemented in Standalone C-Series Servers, this is the preferred mechanism for capturing faults sent by the system. The XML API supports Event Subscription which provides proactive alerting. The XML API also supports queries which can be used to collect data in the fault table on a regular basis.
Cisco UCS MIB Files:
Cisco MIBs are available at the following download site:
ftp://ftp.cisco.com/pub/mibs/supportlists/ucs/ucs-manager-supportlist.html
All Cisco UCS Manager and Standalone C-Series faults are available with SNMP using the cucsFaultTable table and the CISCO-UNIFIED-COMUTING-FAULT-MIB. The table contains one entry for every fault instance. Each entry has variables to indicate the nature of a problem, such as its severity and type. The same object is used to model all Cisco UCS fault types, including equipment problems, FSM failures, configuration or environmental issues, and connectivity issues. The cucsFaultTable table includes all active faults (those that have been raised and need user attention), and all faults that have been cleared but not yet deleted because of the retention interval.
Important OIDs (Object Identifier):
In UCS Manager version 1.3 and later, Cisco UCS Manager sends a cucsFaultActiveNotif event notification whenever a fault is raised. There is one exception to this rule: Cisco UCS Manager does not send event notifications for FSM faults. The trap variables indicate the nature of the problem, including the fault type. Cisco UCS Manager sends a cucsFaultClearNotif event notification whenever a fault has been cleared. A fault is cleared when the underlying issue has been resolved.
In UCS Manager version 1.4 and later, the cucsFaultActiveNotif and cucsFaultClearNotif traps are defined in the CISCO-UNIFIED-COMPUTING-NOTIFS-MIB. All faults can be polled using SNMP GET operations on the cucsFaultTable, which is defined in the CISO-UNIFIED-COMPUTING-FAULT-MIB.
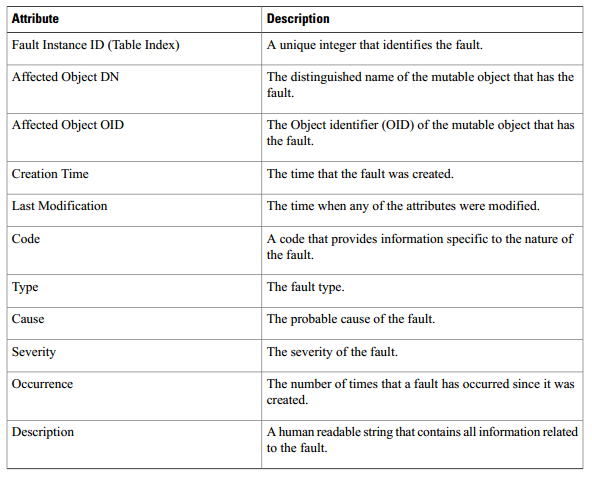
Fault Attributes (Variable Bindings):
MIB Loading Order & Statistics Collection Details:
More details on MIB load ordering and statistics collection including a comprehensive list of Statistics OID and their corresponding Statistics tables are located in the following MIB Reference Guides:
MIB Reference for Cisco UCS Manager:
http://www.cisco.com/en/US/docs/unified_computing/ucs/sw/mib/b-series/b_UCS_MIBRef.pdf
MIB Reference for Cisco UCS Standalone C-Series Servers:
UCS Manager and Standalone C-Series Faults:
In the Cisco UCS, a fault is a mutable object that is managed by the Cisco UCS Manager. Each fault represents a failure in the Cisco UCS instance or an alarm threshold that has been raised. During the lifecycle of a fault, it can change from one state or severity to another.
Each fault includes information about the operational state of the affected object at the time the fault was raised. If the fault is transitional and the failure is resolved, then the object transitions to a functional state. A fault remains in the Cisco UCS Manager until the fault is cleared and deleted according to the settings in the fault collection policy.
You can view all faults in the Cisco UCS instance from either the Cisco UCS Manager CLI or the Cisco UCS Manager GUI. You can also configure the fault collection policy to determine how a Cisco UCS instance collects and retains faults.
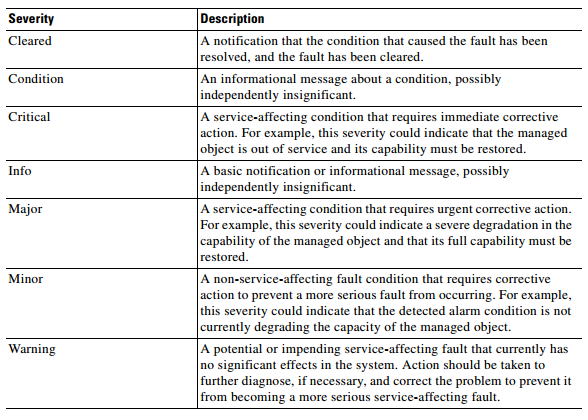
Fault Severities for UCS Manager and Standalone C-Series Servers include:
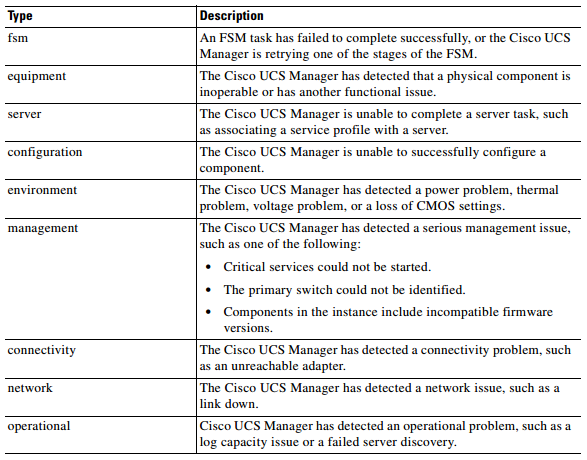
Types of faults for UCS Manager and Standalone C-Series Servers include:
Fault Overview:
The faults in Cisco UCS are stateful, and a fault raised in a Cisco UCS instance transitions through more than one state during its lifecycle. In addition, only one instance of a given fault can exist on each object. If the same fault occurs a second time, the Cisco UCS increases the number of occurrences by one.
A fault has the following lifecycle:
- A condition occurs in the system and the Cisco UCS raises a fault in the active state.
- If the fault is alleviated within a short period of time known as the flap interval, the fault severity remains at its original active value but the fault enters the soaking state. The soaking state indicates that the condition that raised the fault has cleared, but the system is waiting to see whether the fault condition reoccurs.
- If the condition reoccurs during the flap interval, the fault enters the flapping state. Flapping occurs when a fault is raised and cleared several times in rapid succession. If the condition does not reoccur during the flap interval, the fault is cleared.
- Once cleared, the fault enters the retention interval. This interval ensures that the fault reaches the attention of an administrator even if the condition that caused the fault has been alleviated, and that the fault is not deleted prematurely. The retention interval retains the cleared fault for the length of time specified in the fault collection policy.
- If the condition reoccurs during the retention interval, the fault returns to the active state. If the condition does not reoccur, the fault is deleted
- Mark as Read
- Mark as New
- Bookmark
- Permalink
- Report Inappropriate Content
This resource is a great summary guys. Thank you very, very much for the hard work that it takes to develop this level of documentation. I sincerely appreciate it.
Amir
- Mark as Read
- Mark as New
- Bookmark
- Permalink
- Report Inappropriate Content
it seems that UCS manager owns netflow monitoring now, is there any more resource about this feature? I heared that ucsm netflow can detect vm statis.. That would be wonderful if there is more details..
- Mark as Read
- Mark as New
- Bookmark
- Permalink
- Report Inappropriate Content
Netflow was introduced in the latest UCS release -- 2.2.(2c), where the netflow policy can be created. The actual netflow classification is done at the VIC whch provides flow level statistics that are coming in and out of the compute. Couple Netflow with VM-FEX, vm to vm statistics within the same host can now be collected because now all traffic by-passes the hyervisor and are being forwarded in HW.
HTH,
David Nguyen
- Mark as Read
- Mark as New
- Bookmark
- Permalink
- Report Inappropriate Content
All,
Does anyone know if it's possible (not from what I can tell currently) to disable certain traps that UCS sends?
We have 8 domains stood up, and our monitoring servers get inundated with traps for veth, and pc interfaces that go up and down as part of normal operations, and I was wanting to turn these off in an attempt to decrease the amount of traps our monitoring system receives.
Any info would be appreciated,
Thanks,
James
- Mark as Read
- Mark as New
- Bookmark
- Permalink
- Report Inappropriate Content
At this point in time there is no way to disable certain traps that UCS sends. It's something we are looking at in the future, but don't have it as a committed item yet. You will need to filter out the items you want to drop in your NMS system today still.
- Mark as Read
- Mark as New
- Bookmark
- Permalink
- Report Inappropriate Content
I think you could do a "Fault Suppression" but that would be the hole server but still if VIF goes up and down it is most likely that you have done a reboot form UCSM or the OS.
But yes you have to still suppress the fault in your NMS system.
The NMS server would still get the faults.
- Mark as Read
- Mark as New
- Bookmark
- Permalink
- Report Inappropriate Content
Hi Eric.
Do you know if this would be that Cisco still is looking into ?
would you be able to make your own "Fault Suppression Policies" where you would be able to match certain F-Codes like a black list or how ?
- Mark as Read
- Mark as New
- Bookmark
- Permalink
- Report Inappropriate Content
Hi All,
We have installed and using below software on our cisco UCS for traffic monitoring, the concern that we have regarding FC traffic on a specific chassis. let me know what details do you need to troubleshoot this matter.
Cisco UCS monitoring using Grafana, InfluxDB, Telegraf – UTM Installation
Find answers to your questions by entering keywords or phrases in the Search bar above. New here? Use these resources to familiarize yourself with the community:


