- Cisco Community
- Technology and Support
- Collaboration
- Collaboration Knowledge Base
- Packet Capture on CUCM Appliance Model
- Subscribe to RSS Feed
- Mark as New
- Mark as Read
- Bookmark
- Subscribe
- Printer Friendly Page
- Report Inappropriate Content
- Subscribe to RSS Feed
- Mark as New
- Mark as Read
- Bookmark
- Subscribe
- Printer Friendly Page
- Report Inappropriate Content
on
06-09-2010
10:23 AM
- edited on
03-12-2019
09:28 AM
by
NikolaIvanov
When troubleshooting in Cisco Unified Communications Manager, it is sometimes necessary to collect packets which are being sent to and from the network interface on a CUCM server. This document describes the process in four steps.
1. Starting the Capture
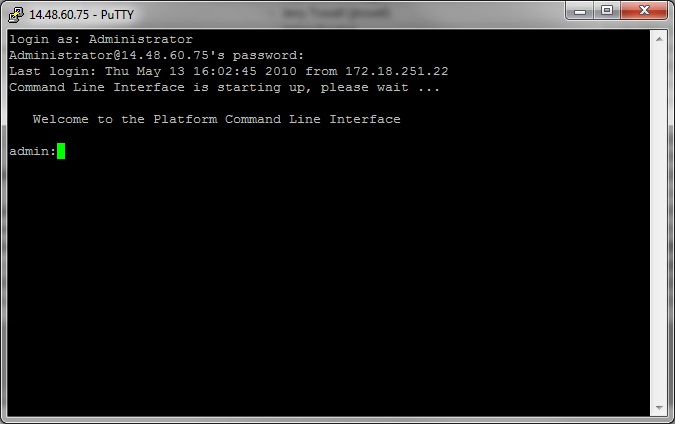
To start the capture, establish a secure shell (SSH) session to the CUCM server authenticating with the Platform Administrator account:
1a. Command Syntax
The command is "utils network capture" and the syntax is as follows:
Syntax:
utils network capture [options]
options optional
page,numeric,file fname,count num,size bytes,src addr,dest addr,port
num,host protocol addr
options are:
page
- pause output
numeric - show hosts as dotted IP
addresses
file fname - output the information to a file
Note: The file will be saved in platform/cli/fname.cap
fname should not contain the "." character
count num - a
count of the number of packets to capture
Note: The maximum count
for the screen is 1000, for a file is 100000
size bytes -
the number of bytes of the packet to capture
Note: The maximum
number of bytes for the screen is 128
For a file it can be
any number or ALL
src addr - the source address of the
packet as a host name or IPV4 address
dest addr - the
destination address of the packet as a host name or IPV4 address
port
num - the port number of the packet (either src or dest)
host
protocol addr - the protocol should be one of the following:
ip/arp/rarp/all. The host address of the packet as a host name or IPV4
address. This option will display all packets to and fro that address.
Note: If "host" is provided, do not provide "src" or "dest"
1b. Capturing all traffic
For a typical capture, one might wish to collect ALL packets of ALL sizes from and to ALL address into a capture file called 'packets.cap'. To do this simply execute on the admin CLI 'utils network capture eth0 file packets count 100000 size all'

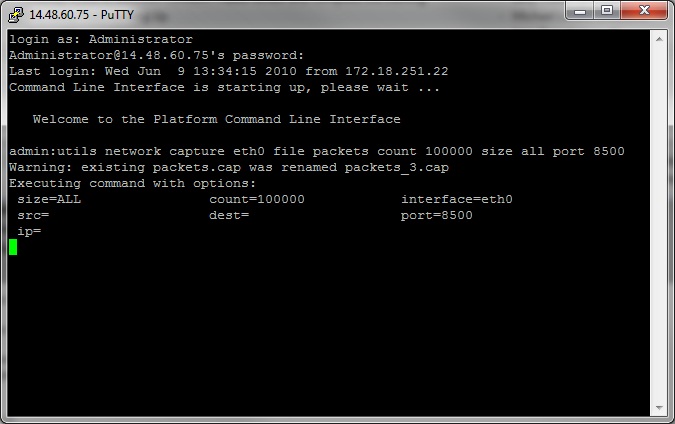
1c. Capturing based on port number
Troubleshooting a communications issue with Cluster Manager, it might be desireable to capture based on a specific port (8500) using the port option.
Note: For more information about which services require communications on each port, refer to the TCP and UDP Port Usage Guide for the applicable version of CUCM.
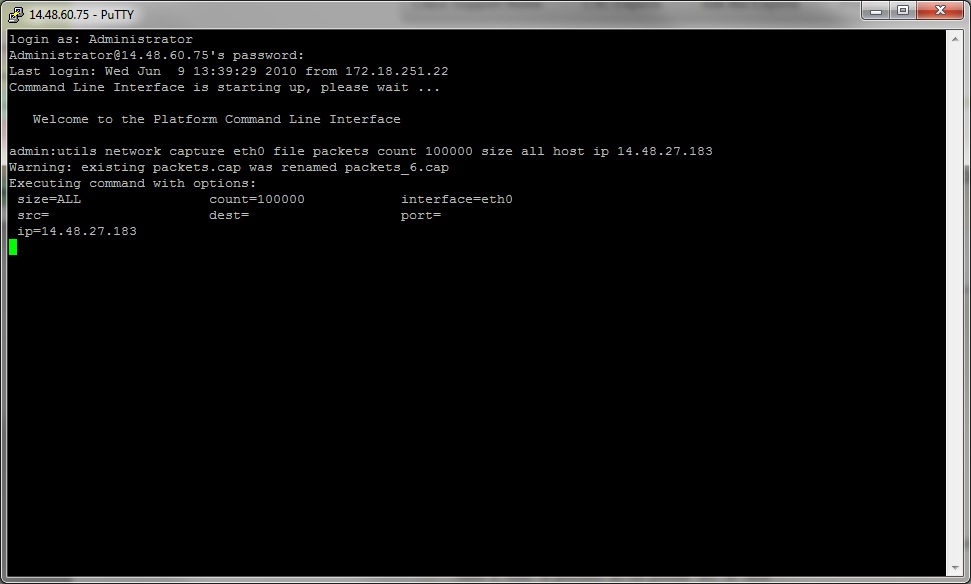
1d. Capturing based on host
In troubleshooting an issue with CUCM and a particular host, it may be necessary to use the 'host' option to filter for traffic to and from a particular host.
Note: it may be necessary to exclude a particular host, in this case use a "!" in front of the IP. An example of this would be "utils network capture eth0 file packets count 100000 size all host ip !10.1.1.1"
2. Reproduce the problem symptom or condition
While the capture is running reproduce the problem symptom or condition so that the necessary packets are included in the capture. If the problem is intermittent it may be necessary to run the capture for an extended period. If the capture ends, it is because the buffer is filled, restart the capture and the previous capture will be automatically renamed so the previous capture should not be lost. If a capture is needed for an extended period of time, it might be worthwhile to capture at the network level via other means such as using a monitor session on a switch.
3. Stopping the capture
To stop the capture hold the Control key and press C on the keyboard. This will cause the capture process to end and no new packets will be added to the capture dump.
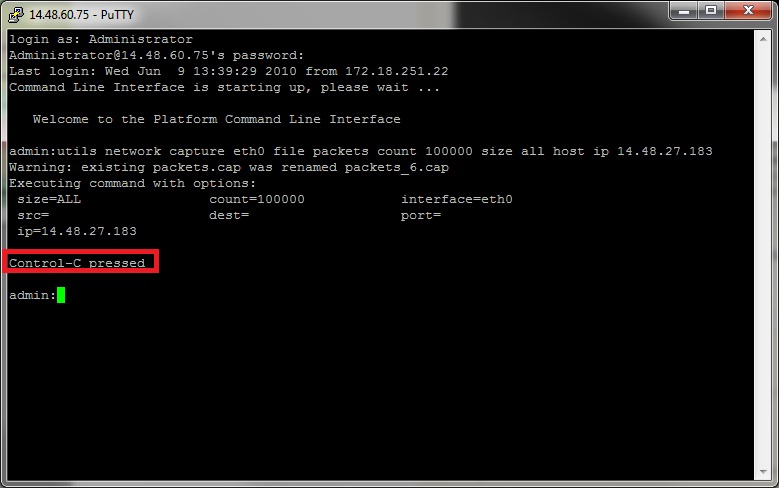
Once this is complete there will be a capture file stored on the server in the location 'activelog platform/cli/'
4. Collecting the capture from the server.
Collecting the capture from the server is the final step. The capture files will be stored in "activelog platform/cli/" location on the server. One can transfer the files through CLI to an SFTP server or to the local PC using the Real Time Monitoring Tool (RTMT).
4a. Transfer capture file through the CLI to an SFTP server
Use the command "file get activelog platform/cli/packets.cap" to collect the packets.cap file to the SFTP server.
Alternatively to collect all .cap files stored on the server, use 'file get activelog platform/cli/*.cap'
Finally, fill in the SFTP server IP/FQDN, port, username, password, and directory information:
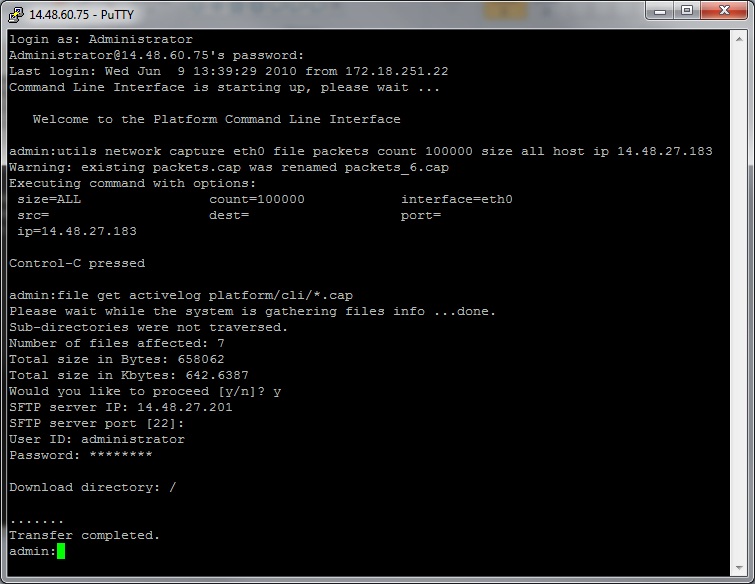
The CLI should indicate success or failure of the file transfer to the SFTP server.
4b. Transfer capture file to local PC using the Real Time Monitoring Tool (RTMT)
This option will not be available to servers running a 5.x CUCM version earlier than 5.1(1), or 6.x version earlier than 6.1(2). See CSCsg13820 and CSCsm76349 for details.
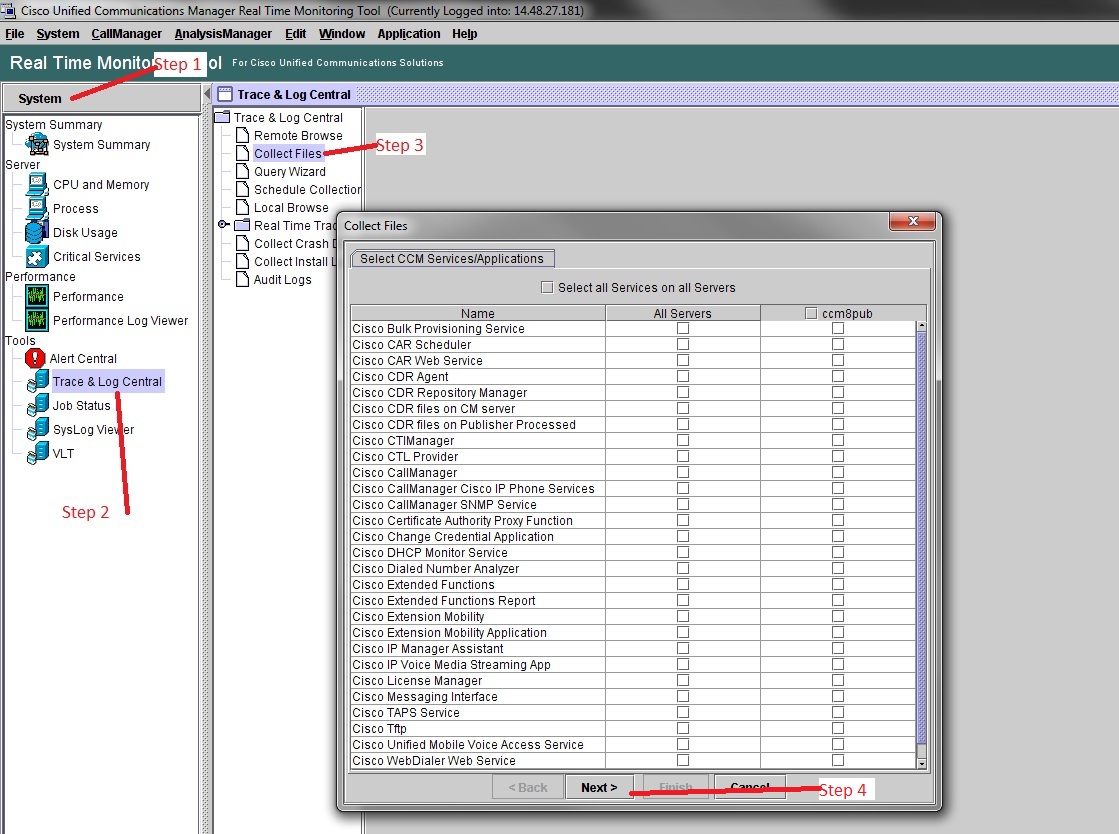
Launch the Real Time Monitoring Tool. If it is not installed on the local PC, install the appropriate version from the CUCM Administration page Applications->Plugins menu. Click "System", then "Trace & Log Central", then double click "Collect Files". Click "Next" through the first menu.
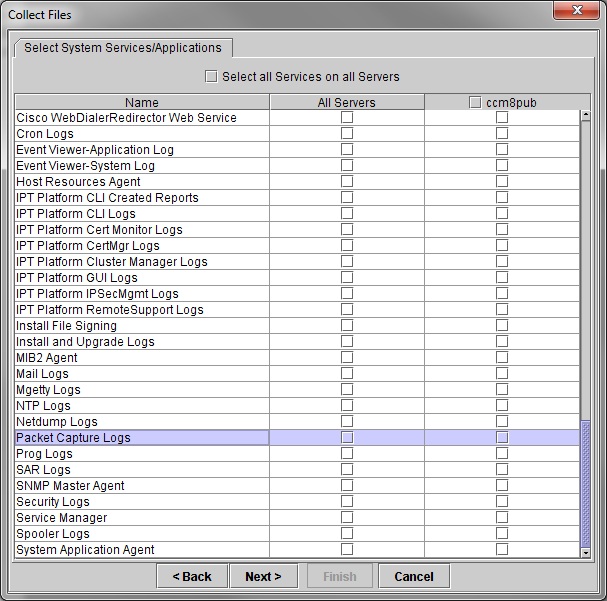
In the second menu choose the checkbox for "Packet Capture Logs" on the server which the capture was performed, then click Next.
On the final screen choose a time range when the capture was performed, and a download directory on the local PC:

RTMT will close this window and proceed to collect the file and store it on the local PC in the specified location.
- Mark as Read
- Mark as New
- Bookmark
- Permalink
- Report Inappropriate Content
Thanks for this, it also works with UCCX version 12.
- Mark as Read
- Mark as New
- Bookmark
- Permalink
- Report Inappropriate Content
is the interface always eth0 ?
- « Previous
-
- 1
- 2
- Next »
Find answers to your questions by entering keywords or phrases in the Search bar above. New here? Use these resources to familiarize yourself with the community: