- Cisco Community
- Technology and Support
- Networking
- Network Management
- Bandwidth gaps in SNMP measurement
- Subscribe to RSS Feed
- Mark Topic as New
- Mark Topic as Read
- Float this Topic for Current User
- Bookmark
- Subscribe
- Mute
- Printer Friendly Page
- Mark as New
- Bookmark
- Subscribe
- Mute
- Subscribe to RSS Feed
- Permalink
- Report Inappropriate Content
06-24-2013 09:28 PM
Hi!
I set up an SNMP-based Cacti bandwidth grapher. Polling time is usually 5 minutes, but I needed more resolution so I set it up to 1 minute. It's working great on everything, so the Cacti installation is fine, but there is something weird about the interface statistics reported from a couple of 6506 devices.
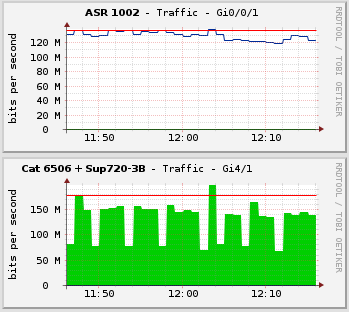
I am including a picture. The two graphs are the two ends of the same link. The graph the top is taken from the ASR1002-end. The one on the bottom is taken from the other end, a Catalyst 6506 switch with a Sup720-3B supervisor.
Please note the following in the picture:
* The gaps, where both have the same polling interval: 1 minute.
* How the ASR as a 130 to 140 Mbps upper limit. The 6506 is at 180 to 200 Mbps, which appear to compensate the gaps (at a lower limit of 70 to 80 Mbps).

Some extra information:
* I used "show interfaces Gi4/1 stats" in exact 1-minute periods to manually elaborate a table based on the reported "Chars In" and analyze it on a spreadsheet. I found extreme highs and lows similar to those on the graph, as opposed of a smooth line like in the ASR graph.
* I have seen this happens in all interfaces of the 6506. I am seeing this in another 6506 too. ASRs are not affected.
* I tried diffing the show interface output of both, finding no significan differences (Keepalives, being the only major difference).
* The poller interval is global to Cacti so I can't set separate intervals, Also, I need to have the 1-minute resolution.
* Both, ends of the link have load-interval set to 5 minutes. However, due to the way SNMP works, shouldn't be any relevant to SNMP readings.
Has anyone seen anything similar? Is this due to misconfiguration or is this a limitation of the platform?
Solved! Go to Solution.
- Labels:
-
Network Management
Accepted Solutions
- Mark as New
- Bookmark
- Subscribe
- Mute
- Subscribe to RSS Feed
- Permalink
- Report Inappropriate Content
07-09-2013 04:28 AM
that was the only thing I could think of, and unfortunately not the right answer. The 64 bit counters should be fine even with a 1 minute interval. I had seen something similar with mrtg years ago, and with a 5 minute interval anything over about 114 Mbps will give a picture like what you're seeing, and changing to 64 bit counters was the fix.
Sorry, but I don't have any other suggestions for you (but I will admit I am not familiar with cacti).
chris
- Mark as New
- Bookmark
- Subscribe
- Mute
- Subscribe to RSS Feed
- Permalink
- Report Inappropriate Content
06-25-2013 10:27 AM
kinda looks like you're polling the OID for the 32 bit counter. Can you try polling using the OID for the 64 bit counters?
chris
- Mark as New
- Bookmark
- Subscribe
- Mute
- Subscribe to RSS Feed
- Permalink
- Report Inappropriate Content
07-08-2013 02:24 PM
Hi, Chris, thanks for replying.
It took me a while to reply, but I wanted to confirm the use of 32-bit or 64-bit counters by using actual tcpdump, just to make really sure.
It's using 1.3.6.1.2.1.31.1.1.1.10.x and 1.3.6.1.2.1.31.1.1.1.6.x as the OID in GetRequest, which match ifHCOutOctets and ifHCInOctets. This means I'm using 64-bit counters.
- Mark as New
- Bookmark
- Subscribe
- Mute
- Subscribe to RSS Feed
- Permalink
- Report Inappropriate Content
07-09-2013 04:28 AM
that was the only thing I could think of, and unfortunately not the right answer. The 64 bit counters should be fine even with a 1 minute interval. I had seen something similar with mrtg years ago, and with a 5 minute interval anything over about 114 Mbps will give a picture like what you're seeing, and changing to 64 bit counters was the fix.
Sorry, but I don't have any other suggestions for you (but I will admit I am not familiar with cacti).
chris
- Mark as New
- Bookmark
- Subscribe
- Mute
- Subscribe to RSS Feed
- Permalink
- Report Inappropriate Content
07-09-2013 05:38 PM
I decided to move this discussion to "Network Management", which seems more appropriate for this topic.
Discover and save your favorite ideas. Come back to expert answers, step-by-step guides, recent topics, and more.
New here? Get started with these tips. How to use Community New member guide