- Cisco Community
- Technology and Support
- Networking
- Network Management
- N7k high latency and dropping
- Subscribe to RSS Feed
- Mark Topic as New
- Mark Topic as Read
- Float this Topic for Current User
- Bookmark
- Subscribe
- Mute
- Printer Friendly Page
N7k high latency and dropping
- Mark as New
- Bookmark
- Subscribe
- Mute
- Subscribe to RSS Feed
- Permalink
- Report Inappropriate Content
03-11-2023 03:58 AM - edited 03-11-2023 04:06 AM
Dears,
We have Cisco Nexus 7K acting as core/gateway for wireless ISP. and we are facing high latency and dropping to this 7K (only to SVI IP) but the traffic going through (traffic from client to internet for example) is working fine.
But any traffic from/to core IP are effected with this behavior (pinging to SVI, routing protocols adjacency).
Kindly note that we have two hardware and both of them have this issue.
Kindly support.
- Labels:
-
Network Management
- Mark as New
- Bookmark
- Subscribe
- Mute
- Subscribe to RSS Feed
- Permalink
- Report Inappropriate Content
03-11-2023 04:25 AM
Provide what Nexus code running.
we are facing high latency and dropping to this 7K (only to SVI IP) < ---can we look the interface drop ?
But any traffic from/to core IP are effected with this behavior (pinging to SVI, routing protocols adjacency). < -- need to provide that test outcome here .
use troubleshooting guide :
- Mark as New
- Bookmark
- Subscribe
- Mute
- Subscribe to RSS Feed
- Permalink
- Report Inappropriate Content
03-11-2023 04:44 AM
- Mark as New
- Bookmark
- Subscribe
- Mute
- Subscribe to RSS Feed
- Permalink
- Report Inappropriate Content
03-11-2023 05:51 AM
since any traffic bypass the NSK work fine only the traffic direct to SVI, then you need to check
CoPP and CPU Queue drop.
- Mark as New
- Bookmark
- Subscribe
- Mute
- Subscribe to RSS Feed
- Permalink
- Report Inappropriate Content
03-11-2023 06:58 AM
- Mark as New
- Bookmark
- Subscribe
- Mute
- Subscribe to RSS Feed
- Permalink
- Report Inappropriate Content
03-11-2023 06:59 AM
Kindly note that I changed the copp profile from strict to lenient
- Mark as New
- Bookmark
- Subscribe
- Mute
- Subscribe to RSS Feed
- Permalink
- Report Inappropriate Content
03-11-2023 02:42 PM
Hi MHM, Is any upnormal things on CPU or copp output?
I changed the copp profile from strict to lenient but still same behavior.
Thanks!
- Mark as New
- Bookmark
- Subscribe
- Mute
- Subscribe to RSS Feed
- Permalink
- Report Inappropriate Content
03-11-2023 03:47 PM
I check it now
- Mark as New
- Bookmark
- Subscribe
- Mute
- Subscribe to RSS Feed
- Permalink
- Report Inappropriate Content
03-12-2023 12:02 PM
 service-policy input copp-system-p-policy-lenient
      match protocol arp
        conformed 663488 bytes,
          5-min offered rate 94784 bytes/sec
          peak rate 94784 bytes/sec at Sat Mar 11 20:00:17 2023
        violated 3536848 bytes,
          5-min violate rate 505264 bytes/sec
          peak rate 505264 bytes/sec at Sat Mar 11 20:00:17 2023

    class-map copp-system-p-class-undesirable (match-any)
      match access-group name copp-system-p-acl-undesirable
      match exception fcoe-fib-miss
        conformed 0 bytes,
          5-min offered rate 0 bytes/sec
          peak rate 0 bytes/sec
        violated 64 bytes,
          5-min violate rate 9 bytes/sec
          peak rate 9 bytes/sec at Sat Mar 11 20:00:17 2023
      module 4:
        conformed 0 bytes,
          5-min offered rate 0 bytes/sec
          peak rate 0 bytes/sec
        violated 60 bytes,
          5-min violate rate 8 bytes/sec
          peak rate 8 bytes/sec at Sat Mar 11 20:00:17 2023

    class-map copp-system-p-class-l2-default (match-any)
      match access-group name copp-system-p-acl-mac-undesirable
      match protocol mpls
      module 3:
        conformed 81651 bytes,
          5-min offered rate 11664 bytes/sec
          peak rate 11664 bytes/sec at Sat Mar 11 20:00:17 2023
        violated 57520 bytes,
          5-min violate rate 8217 bytes/sec
          peak rate 8217 bytes/sec at Sat Mar 11 20:00:17 2023

    class-map class-default (match-any)
      module 3:
        conformed 96646 bytes,
          5-min offered rate 13806 bytes/sec
          peak rate 13806 bytes/sec at Sat Mar 11 20:00:17 2023
        violated 94162 bytes,
          5-min violate rate 13451 bytes/sec
          peak rate 13451 bytes/sec at Sat Mar 11 20:00:17 2023
      module 4:
        conformed 33758 bytes,
          5-min offered rate 4822 bytes/sec
          peak rate 4822 bytes/sec at Sat Mar 11 20:00:17 2023
        violated 4570 bytes,
          5-min violate rate 652 bytes/sec
          peak rate 652 bytes/sec at Sat Mar 11 20:00:17 2023
all the CoPP show peak in same time, that meaning something happened in Sat mar 11,
the CPU history also show us some peak within 72 hours,
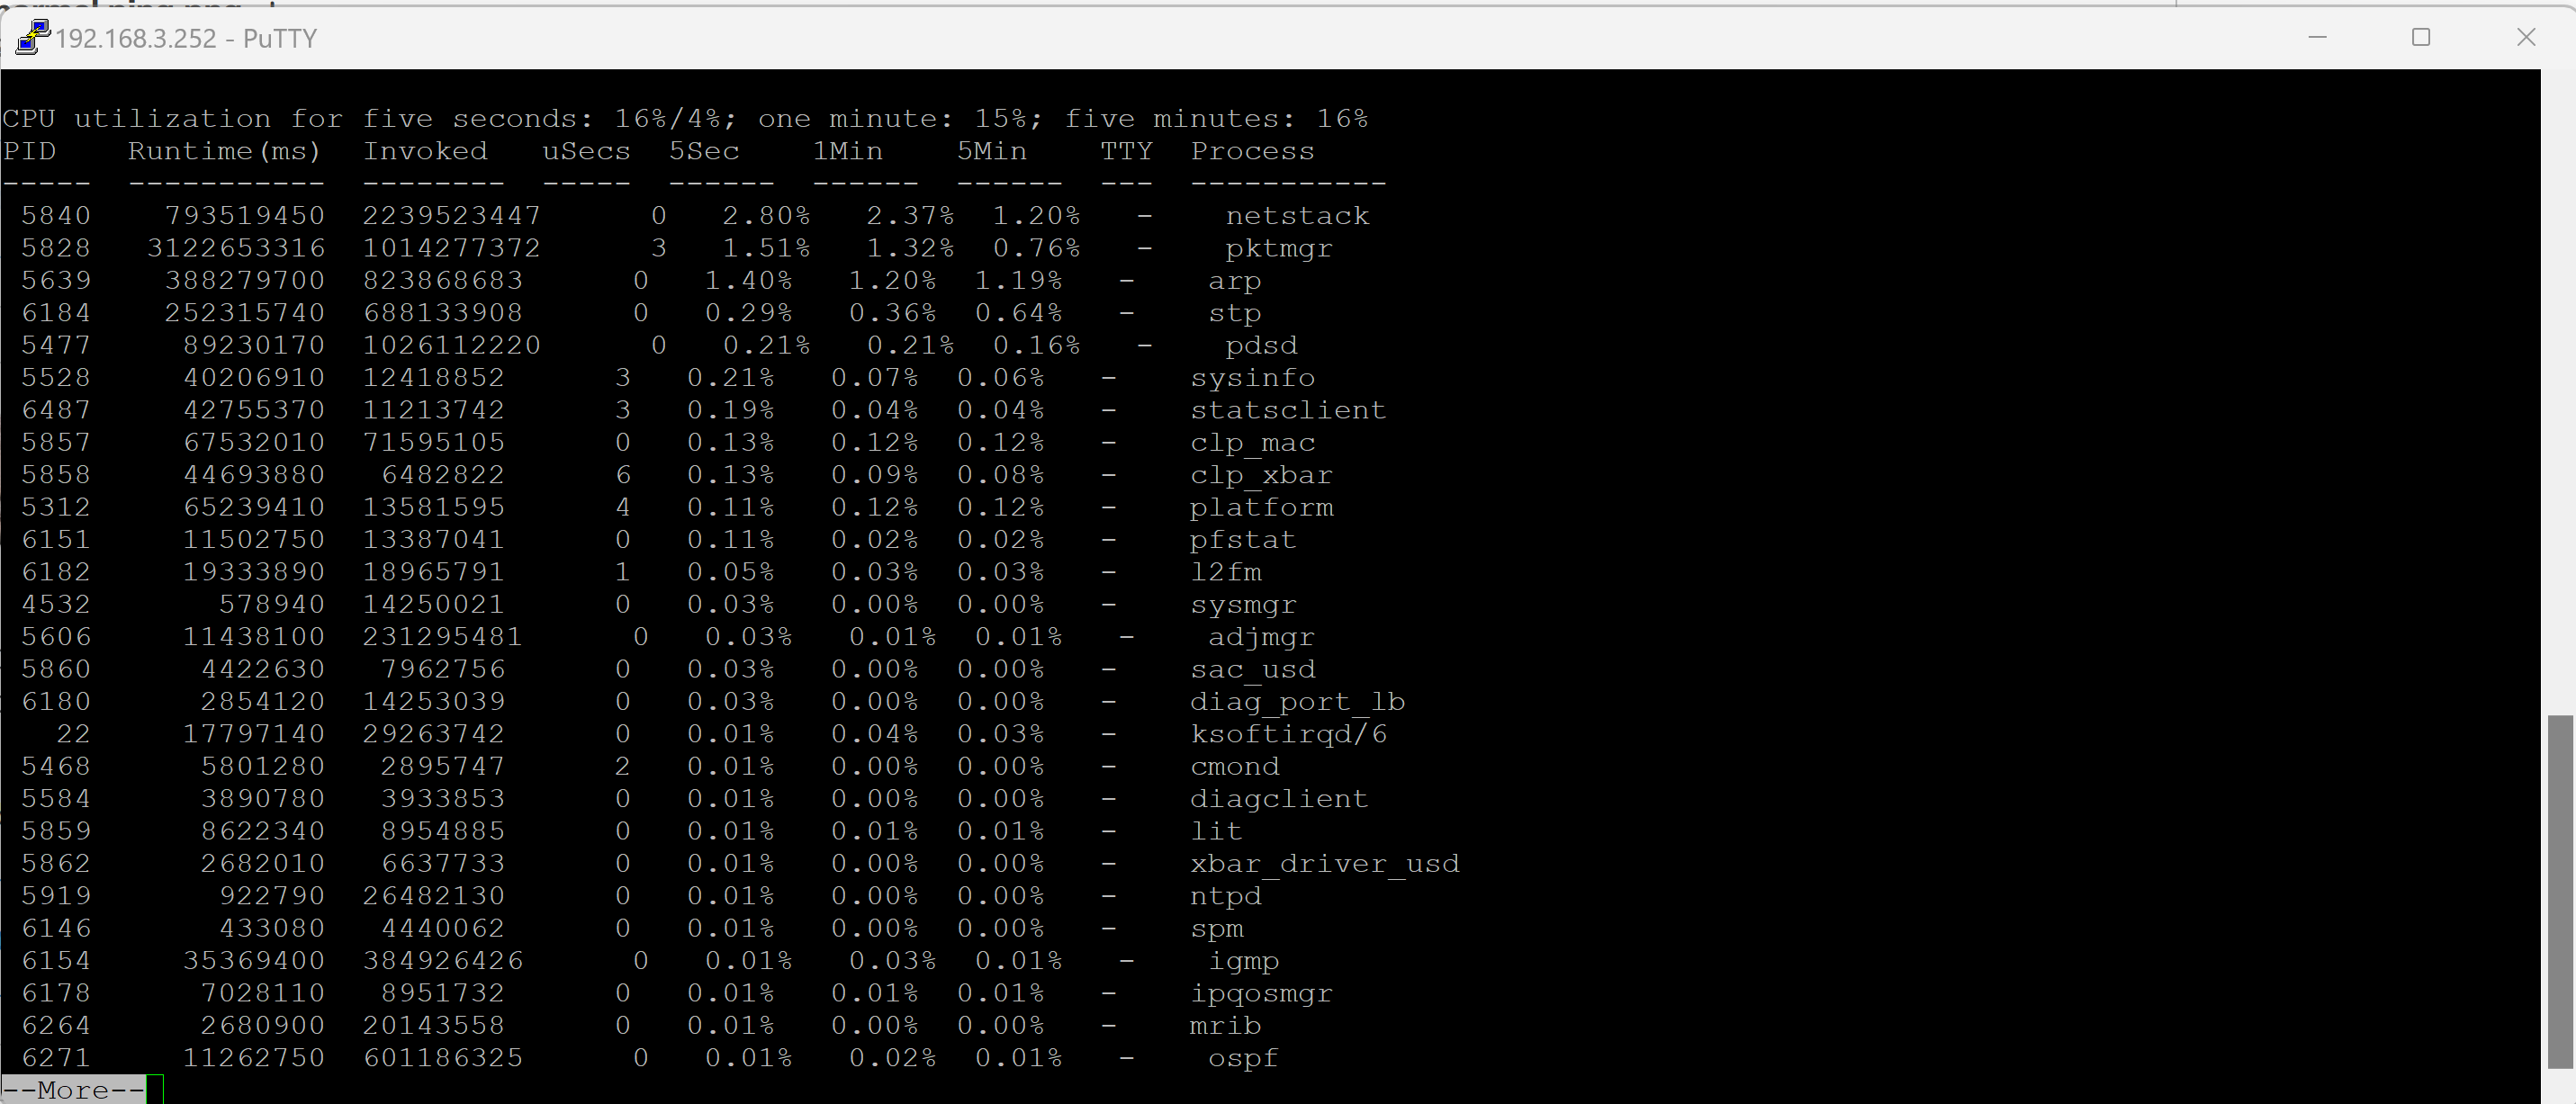
but in CPU sort I dont see anything high except some process which appear in top five in list
the two must which make network slow is ARP and STP.
can you do more monitor for the CPU history and CPU sort and CoPP, check if the peak appear in same time the CPU history show high CPU process around 60-70 %.
- Mark as New
- Bookmark
- Subscribe
- Mute
- Subscribe to RSS Feed
- Permalink
- Report Inappropriate Content
03-12-2023 10:49 PM
Hi MHM,
The CPU isn't exceeding the 25% even during the complete time out (we have console access) and the ARP process is taking about 4% only and STP is less than 1%.
For COPP. Yes there is violation but how we can detect/know the source of this traffic and how we can control it. I tried with ethanalyzer but most of traffic are (PVST and ARP) and I think its normal. I'm right?
Thanks
- Mark as New
- Bookmark
- Subscribe
- Mute
- Subscribe to RSS Feed
- Permalink
- Report Inappropriate Content
03-16-2023 01:37 AM
Anyupdates
- Mark as New
- Bookmark
- Subscribe
- Mute
- Subscribe to RSS Feed
- Permalink
- Report Inappropriate Content
03-13-2023 11:14 PM
Any solution?
- Mark as New
- Bookmark
- Subscribe
- Mute
- Subscribe to RSS Feed
- Permalink
- Report Inappropriate Content
03-16-2023 05:35 AM
@MHM Cisco World @balaji.bandi any solution
- Mark as New
- Bookmark
- Subscribe
- Mute
- Subscribe to RSS Feed
- Permalink
- Report Inappropriate Content
03-16-2023 11:59 AM
@MHM Cisco World @balaji.bandi
Please check below ethanalyzer output
2023-03-16 23:02:45.965367 192.168.123.54 -> 15.218.26.79 TCP 66 52369 > microsoft-ds [SYN] Seq=0 Win=8192 Len=0 MSS=1460 WS=256 SACK_PERM=1
2023-03-16 23:02:45.965382 192.168.123.54 -> 38.98.130.151 TCP 66 52371 > microsoft-ds [SYN] Seq=0 Win=8192 Len=0 MSS=1460 WS=256 SACK_PERM=1
2023-03-16 23:02:45.965396 192.168.123.54 -> 34.130.134.84 TCP 66 52378 > microsoft-ds [SYN] Seq=0 Win=8192 Len=0 MSS=1460 WS=256 SACK_PERM=1
2023-03-16 23:02:45.965410 192.168.123.54 -> 108.38.213.197 TCP 66 52382 > microsoft-ds [SYN] Seq=0 Win=8192 Len=0 MSS=1460 WS=256 SACK_PERM=1
2023-03-16 23:02:45.965441 196.223.157.57 -> 18.198.55.236 ICMP 60 Echo (ping) reply id=0x0015, seq=4372/5137, ttl=255 (request in 817)
2023-03-16 23:02:45.965670 196.29.179.241 -> 13.208.243.220 ICMP 60 Echo (ping) reply id=0x0012, seq=6841/47386, ttl=255 (request in 827)
2023-03-16 23:02:45.966876 192.168.123.54 -> 36.197.250.150 TCP 66 52383 > microsoft-ds [SYN] Seq=0 Win=8192 Len=0 MSS=1460 WS=256 SACK_PERM=1
2023-03-16 23:02:45.966894 192.168.123.54 -> 201.221.55.127 TCP 66 52402 > microsoft-ds [SYN] Seq=0 Win=8192 Len=0 MSS=1460 WS=256 SACK_PERM=1
2023-03-16 23:02:45.966904 192.168.123.54 -> 215.57.169.118 TCP 66 52403 > microsoft-ds [SYN] Seq=0 Win=8192 Len=0 MSS=1460 WS=256 SACK_PERM=1
2023-03-16 23:02:45.966914 192.168.123.54 -> 168.33.139.47 TCP 66 52411 > microsoft-ds [SYN] Seq=0 Win=8192 Len=0 MSS=1460 WS=256 SACK_PERM=1
2023-03-16 23:02:45.967829 192.168.123.54 -> 32.117.229.211 TCP 66 52413 > microsoft-ds [SYN] Seq=0 Win=8192 Len=0 MSS=1460 WS=256 SACK_PERM=1
2023-03-16 23:02:45.967843 192.168.123.54 -> 36.206.71.170 TCP 66 52415 > microsoft-ds [SYN] Seq=0 Win=8192 Len=0 MSS=1460 WS=256 SACK_PERM=1
2023-03-16 23:02:45.967853 192.168.123.54 -> 223.62.87.85 TCP 66 52417 > microsoft-ds [SYN] Seq=0 Win=8192 Len=0 MSS=1460 WS=256 SACK_PERM=1
2023-03-16 23:02:45.967862 192.168.123.54 -> 108.4.239.120 TCP 66 52427 > microsoft-ds [SYN] Seq=0 Win=8192 Len=0 MSS=1460 WS=256 SACK_PERM=1
2023-03-16 23:02:45.967872 192.168.123.54 -> 151.158.227.197 TCP 66 52430 > microsoft-ds [SYN] Seq=0 Win=8192 Len=0 MSS=1460 WS=256 SACK_PERM=1
Note: 192.168.123.54 isn't our IP
Thanks!
- Mark as New
- Bookmark
- Subscribe
- Mute
- Subscribe to RSS Feed
- Permalink
- Report Inappropriate Content
03-17-2023 04:14 AM
2023-03-16 23:02:45.965382 192.168.123.54 -> 38.98.130.151 TCP 66 52371 > microsoft-ds [SYN] Seq=0 Win=8192 Len=0 MSS=1460 WS=256 SACK_PERM=1
if the traffic is between two Host in your network why it need to punt to CPU??
are 192.168.123.54 is your VLAN SVI IP ?
Discover and save your favorite ideas. Come back to expert answers, step-by-step guides, recent topics, and more.
New here? Get started with these tips. How to use Community New member guide