- Cisco Community
- Technology and Support
- Security
- Physical Security
- Troubleshooting VSOM&VSMC metrics to fix Load Average alerts
- Subscribe to RSS Feed
- Mark Topic as New
- Mark Topic as Read
- Float this Topic for Current User
- Bookmark
- Subscribe
- Mute
- Printer Friendly Page
Troubleshooting VSOM&VSMC metrics to fix Load Average alerts
")
- Mark as New
- Bookmark
- Subscribe
- Mute
- Subscribe to RSS Feed
- Permalink
- Report Inappropriate Content
01-08-2014 11:09 PM
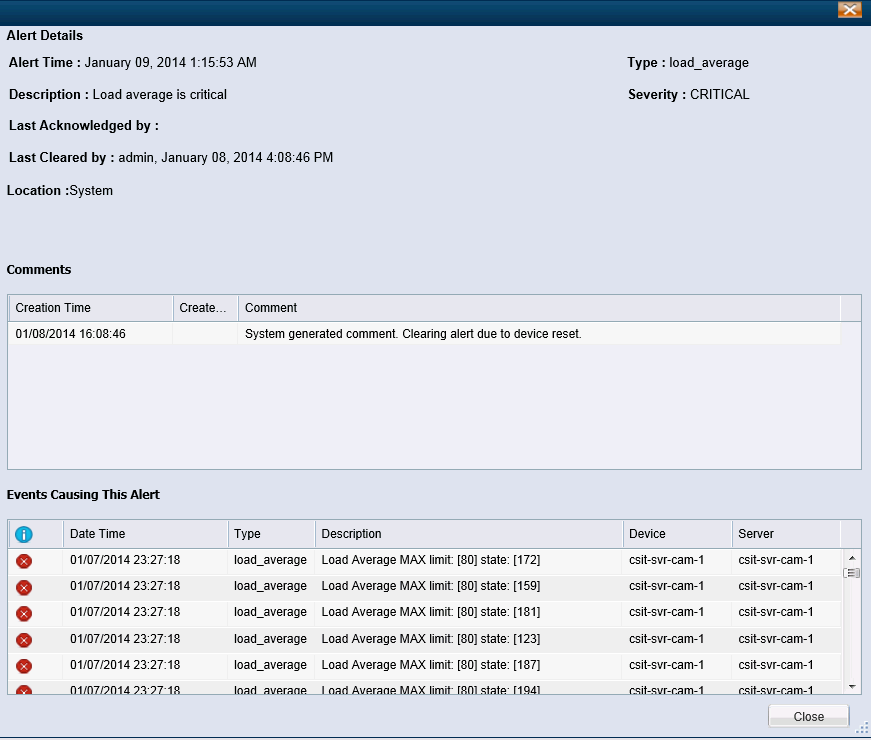
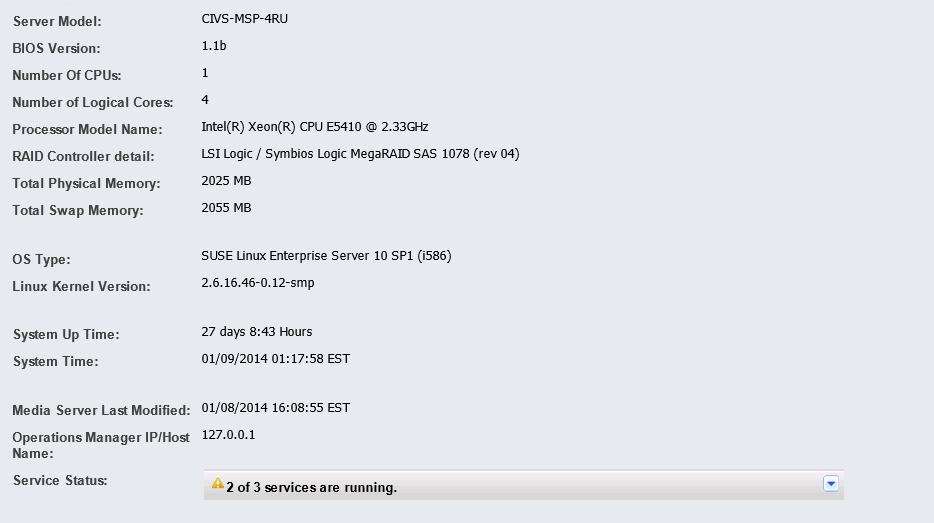
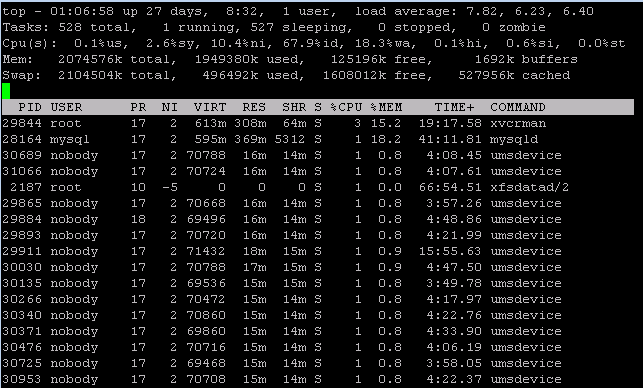
Hello everybody! I have been having some problems making sense of the various metrics in the Cisco video surveillance that allow you to monitor performance. I have a server that is generating alerts about the load average being critical. After login in the terminal and reviewing the information from “top” command I can see that the load average is 7.82, 6.23, 6.40. I have seen the numbers go up much higher than what I am reporting. When I compare the output from "top" command to the daily graph found in VSMC page the number don’t make sense. The VSMC graphs show the system operating within normal loads. I also looked at the “Hardware Status” page under VSMC and found that the system Load Average is 177%. How does the system calculate the Load Average reported in VSMC? Am I reading the daily graphs correctly? How can I determine what is causing the Load Average alert to be trigger?


- Labels:
-
Physical Security
- Mark as New
- Bookmark
- Subscribe
- Mute
- Subscribe to RSS Feed
- Permalink
- Report Inappropriate Content
01-09-2014 08:24 AM
It appears as though you are running VSM7 on a CIVS-MSP-4RU. These are *extremely* old servers and I believe the metric thresholds are designed and tuned for CPS / UCS hardware platforms. Your mileage will surely vary on a very old and (likely) unsupported hardware platform. You may wish to check with TAC.
How many streams are concurrently running on the platform?
Scott Olsen
Solutions Specialist
Bulletproof Solutions Inc.
Web: www.bulletproofsi.com
- Mark as New
- Bookmark
- Subscribe
- Mute
- Subscribe to RSS Feed
- Permalink
- Report Inappropriate Content
01-09-2014 08:43 AM
I have 190 streams MPEG_4 4cif 704X480 10 frames. I had the same problem with the metrics in 6.x version. I was wondering what the system uses to calculate the Load Average? Is it a combination of CPU, memory usages, and disk I/O over a period of time?
")
")
- Mark as New
- Bookmark
- Subscribe
- Mute
- Subscribe to RSS Feed
- Permalink
- Report Inappropriate Content
01-09-2014 08:41 AM
HI Emanuel,
We have seen this before. How many cameras do you have per server? How is your I/O? Do you have lots of clients viewing video? I guarantee TAC knows all about this problem.
My bet is that you are running a lot of cameras at low bitrare and you also have lots of SASD clients. Just a hunch.
Good luck!
- Mark as New
- Bookmark
- Subscribe
- Mute
- Subscribe to RSS Feed
- Permalink
- Report Inappropriate Content
01-09-2014 08:52 AM
csit-svr-cam-1:~ # iostat -d -x 5 3
Linux 2.6.16.46-0.12-smp (csit-svr-cam-1) 01/09/14
Device: rrqm/s wrqm/s r/s w/s rsec/s wsec/s rkB/s wkB/s avgrq-sz avgqu-sz await svctm %util
sda 0.47 3.26 1.74 1.03 80.47 35.88 40.23 17.94 41.95 0.19 68.71 26.05 7.23
sdb 0.01 9.76 13.10 49.69 116.21 1342.39 58.11 671.20 23.23 0.17 2.65 9.27 58.20
sdc 0.32 7.06 31.49 62.24 1244.84 543.81 622.42 271.91 19.08 1.34 14.28 8.31 77.89
Device: rrqm/s wrqm/s r/s w/s rsec/s wsec/s rkB/s wkB/s avgrq-sz avgqu-sz await svctm %util
sda 0.20 3.19 2.79 0.60 67.07 31.94 33.53 15.97 29.18 0.55 163.29 62.12 21.08
sdb 0.00 23.35 11.98 86.63 99.00 35470.06 49.50 17735.03 360.73 18.54 185.45 7.42 73.13
sdc 0.00 0.00 5.99 15.97 105.39 701.40 52.69 350.70 36.75 2.85 132.22 33.16 72.81
Device: rrqm/s wrqm/s r/s w/s rsec/s wsec/s rkB/s wkB/s avgrq-sz avgqu-sz await svctm %util
sda 0.00 2.60 1.20 0.40 9.60 25.60 4.80 12.80 22.00 0.03 21.00 15.50 2.48
sdb 0.00 9.20 16.60 77.80 136.00 21927.20 68.00 10963.60 233.72 10.26 114.64 5.10 48.16
sdc 0.00 0.80 7.20 28.80 115.20 1336.60 57.60 668.30 40.33 1.22 34.02 17.13 61.68
- Mark as New
- Bookmark
- Subscribe
- Mute
- Subscribe to RSS Feed
- Permalink
- Report Inappropriate Content
01-09-2014 09:03 AM
We too had this problem. And it is simply that there are "too many" cameras on the media server, as has been mentioned in this thread. Like you, we had the same number of cameras on 6.x but got all these load average errors on 7.x. The thing is the 6.x platform was also oversubscribed, but in 7.x the health monitering reaches out and tells you that is the case. In 6.x it chugs along and no one is the wiser. It has simply always been this way, but now you are aware due to the improved health monitering in 7.x
The solution is to carve out some of the more often viewed cameras onto a 1RU server. Reducing by 30 or 40 cameras should take care of it.
Doing nothing means you'll be revving the server. You made it this far so maybe that is OK, but in 7.x you are alerted when you reach the max supported threshhold. Be warned!
- Mark as New
- Bookmark
- Subscribe
- Mute
- Subscribe to RSS Feed
- Permalink
- Report Inappropriate Content
01-09-2014 10:25 AM
I've been fighting the same issues but I can answer your first question, they appear to be calculating Load as "load average"/"Number of Logical CPUs" x 100, so for a quad-core system load averages above 3.2(80%) will trigger the alert.
Reducing the number of streams per media server is the only way I've managed to lower load so far, i'd have ignored the alert but I'm/was? experiencing stability issues (once a month sometimes twice a week all streams stop until the services are restarted ).
Other thoughts
The new server I spun up (Media Server only) seems to be able to handle more streams so I may look at running Operation Manager on a dedicated server.
I'm running Virtualized on UCS B-series using CPS-SS-4U for storage.
Discover and save your favorite ideas. Come back to expert answers, step-by-step guides, recent topics, and more.
New here? Get started with these tips. How to use Community New member guide