- Cisco Community
- Technology and Support
- Networking
- Routing
- High CPU on CISCO1941
- Subscribe to RSS Feed
- Mark Topic as New
- Mark Topic as Read
- Float this Topic for Current User
- Bookmark
- Subscribe
- Mute
- Printer Friendly Page
High CPU on CISCO1941
- Mark as New
- Bookmark
- Subscribe
- Mute
- Subscribe to RSS Feed
- Permalink
- Report Inappropriate Content
01-30-2014 11:17 AM - edited 03-04-2019 10:12 PM
Hi,
If anyone can help explain how the CPU usage on ISRG2 routers works I would greatly appreciate it. Normally when I see a CPU usage spike you can use the show proc cpu sorted command to see what process is using that CPU and then troubleshoot from there. But occasionally I have seen sustained CPU usage without any process showing its using the CPU.
Example:
CISCO1941 router
CPU spike to %99 for 1 hour
show proc cpu sorted shows no process using the cpu more than %1
My only guess is the router has ZBF configured and there is a file transfer or backup being software switched and is using all of the CPU it can get its hands on. I just don't understand why that wouldn't show in the show process cpu output as a process using the CPU.
ATLRTR-1941#show proc cpu sorted
CPU utilization for five seconds: 95%/94%; one minute: 97%; five minutes: 98%
PID Runtime(ms) Invoked uSecs 5Sec 1Min 5Min TTY Process
121 3545996 16326613 217 0.15% 0.07% 0.03% 0 IP Input
84 768 106 7245 0.15% 0.05% 0.01% 132 Virtual Exec
93 514168 993813653 0 0.15% 0.11% 0.08% 0 Ethernet Msec Ti
2 86832 1586153 54 0.07% 0.04% 0.05% 0 Load Meter
48 63732 831382 76 0.07% 0.00% 0.00% 0 Net Background
50 25177852 1194371 21080 0.07% 0.03% 0.11% 0 Logger
Message was edited by: kyle woodhouse Apparently the forums here dont support CONSOLAS font which is the best way to view router output. Note to forum admins ADD CONSOLAS FONT SUPPORT!!
- Labels:
-
Other Routing
- Mark as New
- Bookmark
- Subscribe
- Mute
- Subscribe to RSS Feed
- Permalink
- Report Inappropriate Content
01-30-2014 12:50 PM
Hello
I cannot see the txt file you attached as I am posting from my iPad however You don't state what troubleshooting procedures have you done.
Have you checked the memory utilisation-what does this show.
Does this router have any LAN facing connections and have you tried temporally disabling this interface and see if the CPU utilisation drops?
Can you post the config of the router?
Res
Paul
Sent from Cisco Technical Support iPad App
Please rate and mark as an accepted solution if you have found any of the information provided useful.
This then could assist others on these forums to find a valuable answer and broadens the community’s global network.
Kind Regards
Paul
- Mark as New
- Bookmark
- Subscribe
- Mute
- Subscribe to RSS Feed
- Permalink
- Report Inappropriate Content
01-30-2014 01:26 PM
What are running on the router? BGP? OSPF? VPN? Etc, etc?
- Mark as New
- Bookmark
- Subscribe
- Mute
- Subscribe to RSS Feed
- Permalink
- Report Inappropriate Content
01-31-2014 09:22 AM
Hi, Memory utilization does not change. I have SNMP configured and can see the graphs so i know memory isnt changing. Will post some graphs in a second. I think disabling the internet facing interface would solve the issue but thats not the point. The point is, why is the CPU going to 100% without a process showing me its using the CPU. What is the point of the show process CPU command if it doesnt accuratly display processes that are using the CPU?
- Mark as New
- Bookmark
- Subscribe
- Mute
- Subscribe to RSS Feed
- Permalink
- Report Inappropriate Content
01-31-2014 09:26 AM
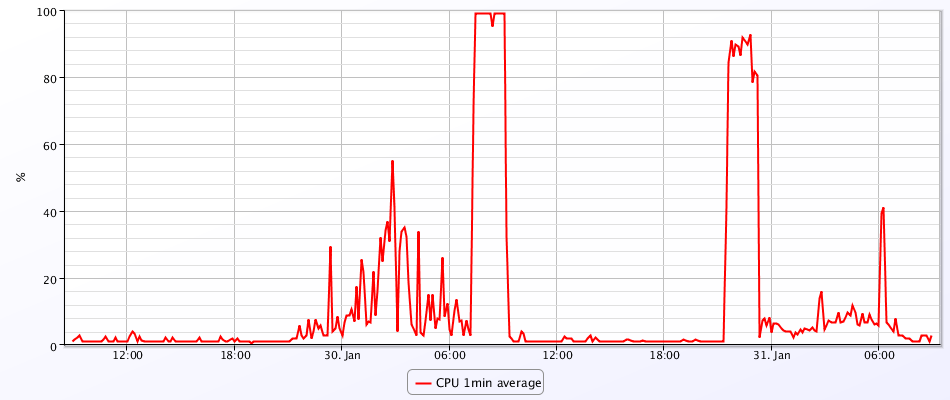
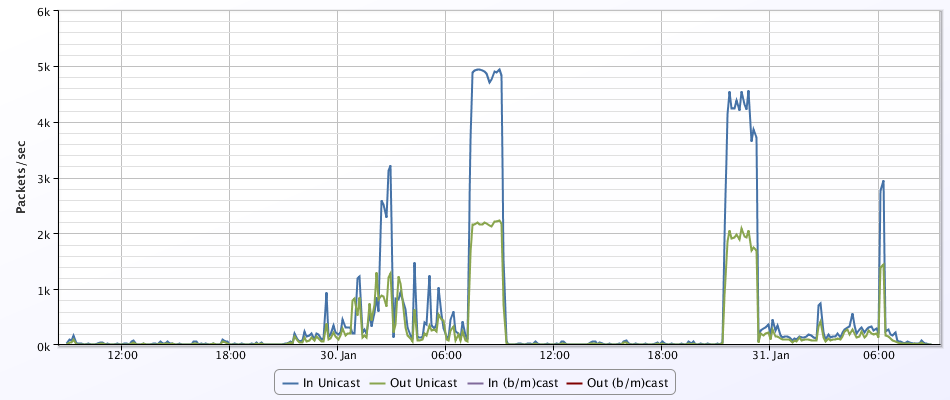
I think my guess of it being the zone based firewall inspecting traffic is the best answer here. I just dont understand how ZBF can use the CPU without it displaying in the "show proc cpu sorted" command. Might open a TAC case to verify how this could possibly make sense.
Pretty clear that incoming traffic is causing the CPU spike based on the graphs.
CPU - 2 days

Packets per second - 2 days

- Mark as New
- Bookmark
- Subscribe
- Mute
- Subscribe to RSS Feed
- Permalink
- Report Inappropriate Content
02-01-2014 02:28 AM
Hi Kyle,
I dont think you provided entire output of cmd: show proc cpu sorted
Can you please uploded entire output? Also you can tune this command with "| exclude 0.00%__0.00%__0.00%"
It will exclude all lines with all zeros.
for example:
SW2#sh processes cpu sorted | exclude 0.00%__0.00%__0.00%
CPU utilization for five seconds: 6%/0%; one minute: 8%; five minutes: 8%
PID Runtime(ms) Invoked uSecs 5Sec 1Min 5Min TTY Process
199 892900 6503463 137 0.63% 1.16% 1.20% 0 Spanning Tree
171 1246 5386 231 0.15% 0.02% 0.00% 0 VMATM Callback
3 178 132 1348 0.00% 0.13% 0.04% 0 Exec
4 384174 18195 21114 0.00% 1.07% 0.86% 0 Check heaps
34 14126 682 20712 0.00% 0.02% 0.00% 0 Per-minute Jobs
72 596 1211609 0 0.00% 0.01% 0.00% 0 HLFM address ret
74 9932 4077 2436 0.00% 0.01% 0.00% 0 HULC Tcam Memory
126 3771 968057 3 0.00% 0.01% 0.00% 0 Hulc LED Process
135 13846 8166 1695 0.00% 0.04% 0.00% 0 HQM Stack Proces
231 4403 3152 1396 0.00% 0.02% 0.00% 0 IGMPSN L2MCM
Best Regards
Please rate all helpful posts and close solved questions
- Mark as New
- Bookmark
- Subscribe
- Mute
- Subscribe to RSS Feed
- Permalink
- Report Inappropriate Content
02-03-2014 06:30 PM
Hi Blau,
I am very familiar with how to pipe the show proc cpu command and exclude lines that have all 0 and i did this during the event but i did not save the output. The issue has not happened since so i cannot post output again but i assure you there were no processes that were using more than 1% of the CPU. This is what makes no sense to me.
I am very sure it is the zone based firewall portion of the config that is causing the high CPU because that process is stateful but i still dont understand how the cpu can be at %99 without any command to verify whats using the CPU.
Still playing around in the lab to test this but might open a TAC case if i cant figure it out. Thanks though!
Discover and save your favorite ideas. Come back to expert answers, step-by-step guides, recent topics, and more.
New here? Get started with these tips. How to use Community New member guide