- Cisco Community
- Technology and Support
- Networking
- Routing
- hight utilization cpu router 2811
- Subscribe to RSS Feed
- Mark Topic as New
- Mark Topic as Read
- Float this Topic for Current User
- Bookmark
- Subscribe
- Mute
- Printer Friendly Page
hight utilization cpu router 2811
- Mark as New
- Bookmark
- Subscribe
- Mute
- Subscribe to RSS Feed
- Permalink
- Report Inappropriate Content
10-04-2017 08:40 AM - edited 03-05-2019 09:14 AM
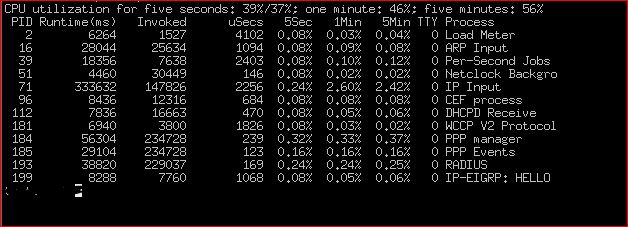
Hi, I have a problem with router 2811 , hight utilization CPU but I don't determinated the process . See the attached file (now is not very hight but before I had more then 65 % ). In this case when don't see the process who cause the utilization CPU , what can I do? thanks a lot for the help !!
CPU% per second (last 60 seconds)
6468764444456344437576679666776653468677886969876667755666
4240374051292937258818710645525299854215928073521011298134
100
90 * * * **
80 * * * * * *#* * **
70 #** * ***##* *#** ** *##**#*##* ** *
60 * *#** ** *############** ######*############*#####
50 # #### * ** * #############** *######*##################
40 #######*#**##**#**###############*##########################
30 ############################################################
20 ############################################################
10 ############################################################
0....5....1....1....2....2....3....3....4....4....5....5....
0 5 0 5 0 5 0 5 0 5
- Labels:
-
Other Routing
- Mark as New
- Bookmark
- Subscribe
- Mute
- Subscribe to RSS Feed
- Permalink
- Report Inappropriate Content
10-04-2017 08:57 AM
Next time this happens use the "sh proc c | e 0.00" command. You should only see the higher utilized processes. Also, check the utilization of all the interfaces. Might be a high traffic issue.
May want to post the config too, as it would help to know what services are running (routing protocols, VPN, NAT, etc).
- Mark as New
- Bookmark
- Subscribe
- Mute
- Subscribe to RSS Feed
- Permalink
- Report Inappropriate Content
10-04-2017 09:10 AM
- Mark as New
- Bookmark
- Subscribe
- Mute
- Subscribe to RSS Feed
- Permalink
- Report Inappropriate Content
10-04-2017 09:36 AM
Understand your question. It is possible it could be a process not used by the IOS daemon so that's why you aren't seeing it.
It looks like your average CPU in normal operation is around 40%. The # represents the CPU average and the * is the maximum. Those maximum spikes could be very brief and tough to actually see and when it spikes it's on average only 20% more. That being said, run the same command when it's happening again (sh proc c | e 0.00) and look for increased throughput on the interfaces and you may find your answer.
Also, here's a link that may help:
https://www.cisco.com/c/en/us/support/docs/routers/10000-series-routers/15095-highcpu.html
- Mark as New
- Bookmark
- Subscribe
- Mute
- Subscribe to RSS Feed
- Permalink
- Report Inappropriate Content
10-04-2017 01:06 PM
Often interrupt CPU just represents the performance of the router relative to the traffic transiting it. Keep in mind the 2811 tops out at about 50 Mbps, but is working load should be kept to about 10 Mbps. (Yea, it has 100 Mbps interfaces, but it doesn't offer 100 Mbps capacity.)
What's your aggregate bandwidth going through the 2811 when the CPU goes up to higher percentages?
- Mark as New
- Bookmark
- Subscribe
- Mute
- Subscribe to RSS Feed
- Permalink
- Report Inappropriate Content
01-04-2018 07:50 AM - edited 01-04-2018 07:56 AM
Sorry for my late response.
now I have a this situation in the router:
CPU utilization for five seconds: 48%/32%; one minute: 52%; five minutes: 53%
Please see the outpot of the command sh inter summary
*: interface is up
IHQ: pkts in input hold queue IQD: pkts dropped from input queue
OHQ: pkts in output hold queue OQD: pkts dropped from output queue
RXBS: rx rate (bits/sec) RXPS: rx rate (pkts/sec)
TXBS: tx rate (bits/sec) TXPS: tx rate (pkts/sec)
TRTL: throttle count
Interface IHQ IQD OHQ OQD RXBS RXPS TXBS TXPS TRTL
------------------------------------------------------------------------
* FastEthernet0/0 0 0 0 0 4000 5 4000 4 0
* FastEthernet0/0.1 - - - - - - - - -
* FastEthernet0/0.101 - - - - - - - - -
* FastEthernet0/1 0 2025 0 0 5114000 1220 5093000 1113 225
* FastEthernet0/1.1 - - - - - - - - -
* FastEthernet0/1.5 - - - - - - - - -
* FastEthernet0/1.9 - - - - - - - - -
* FastEthernet0/1.11 - - - - - - - - -
* FastEthernet0/1.20 - - - - - - - - -
* FastEthernet0/1.101 - - - - - - - - -
* FastEthernet0/1.102 - - - - - - - - -
FastEthernet0/1.1001 - - - - - - - - -
Serial0/0/0 0 0 0 0 0 0 0 0 0
* Loopback0 0 0 0 0 0 0 0 0 0
* Loopback1 0 0 0 0 0 0 0 0 0
* Loopback3 0 0 0 0 0 0 0 0 0
* Tunnel0 0 0 0 2 707000 209 268000 200 0
* Tunnel1 0 0 0 0 1215000 118 67000 94 0
* Tunnel2 0 0 0 33 0 0 0 0 0
* Tunnel10 0 0 0 0 0 0 0 0 0
NOTE:No separate counters are maintained for subinterfaces
Hence Details of subinterface are not shown
- Mark as New
- Bookmark
- Subscribe
- Mute
- Subscribe to RSS Feed
- Permalink
- Report Inappropriate Content
01-04-2018 09:00 AM
Hello
Are you running dynamic or static routing?
sh ip route summary
res
paul
Please rate and mark as an accepted solution if you have found any of the information provided useful.
This then could assist others on these forums to find a valuable answer and broadens the community’s global network.
Kind Regards
Paul
- Mark as New
- Bookmark
- Subscribe
- Mute
- Subscribe to RSS Feed
- Permalink
- Report Inappropriate Content
01-04-2018 09:17 AM
thanks
sh ip route summ
IP routing table name is Default-IP-Routing-Table(0)
IP routing table maximum-paths is 16
Route Source Networks Subnets Overhead Memory (bytes)
connected 0 16 1152 2176
static 0 10 720 1360
eigrp 1 1 0 72 136
internal 8 9248
Total 9 26 1944 12920
- Mark as New
- Bookmark
- Subscribe
- Mute
- Subscribe to RSS Feed
- Permalink
- Report Inappropriate Content
01-04-2018 09:05 AM
48 - 32 = 16% of process CPU, which is a bit higher than desired. You need to identify if there are also any software processes using high CPU.
I also see f0/1 has some IQD, which often indicates the router is not keeping up with traffic bursts.
Discover and save your favorite ideas. Come back to expert answers, step-by-step guides, recent topics, and more.
New here? Get started with these tips. How to use Community New member guide