- Cisco Community
- Technology and Support
- Networking
- Switching
- CPU Utilization and interface Summary
- Subscribe to RSS Feed
- Mark Topic as New
- Mark Topic as Read
- Float this Topic for Current User
- Bookmark
- Subscribe
- Mute
- Printer Friendly Page
CPU Utilization and interface Summary
- Mark as New
- Bookmark
- Subscribe
- Mute
- Subscribe to RSS Feed
- Permalink
- Report Inappropriate Content
07-24-2017 01:50 AM - edited 03-08-2019 11:26 AM
Dears
Q- want to know how i will check my switch CUP Utilizatioin and how i will know my switch cpu is fine or not?
Q- How to calculate CPU Utilization? and what bit rate is best?
Q- how to know how much bits transfer in my interface one by one ?
Q- How to know my switch health is good or not?
I am using Layer 3 Switch
I want to know the command for Cisco 3000 and 4000 series switch.
I want to check everything in my switch how i will do that and what are the commands.
- Labels:
-
Other Switching
")
")
- Mark as New
- Bookmark
- Subscribe
- Mute
- Subscribe to RSS Feed
- Permalink
- Report Inappropriate Content
07-24-2017 04:51 AM
Hi
The command to verify the CPU is:
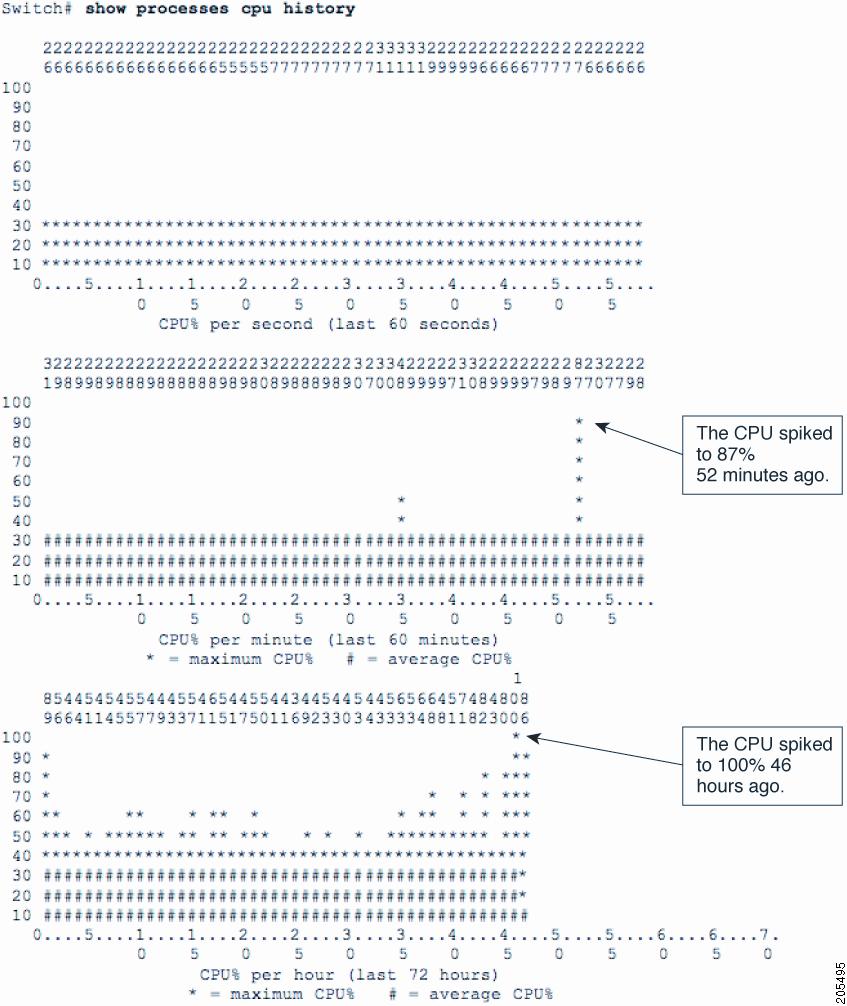
show process cpu history (it will display a graphic so you will be able to analize by second, minute or hour)
show process cpu sorted (it will show you the % used by the processes in real time)
Now to see the bit transfer on your interface you can use show interface <interface>
About the health it depends how the switch is configured and for what it was destined, for example a switch for servers or a switch for routing could generate more traffic than a switch for end users. Also a STP problem can generate high CPU utilization.
Usually a switch for end users could use 10-20% of CPU resources. You could take as reference 50-60 as warning, 60+ it could indicate a problem.
Hope it is useful
🙂
>> Marcar como útil o contestado, si la respuesta resolvió la duda, esto ayuda a futuras consultas de otros miembros de la comunidad. <<
- Mark as New
- Bookmark
- Subscribe
- Mute
- Subscribe to RSS Feed
- Permalink
- Report Inappropriate Content
07-24-2017 09:00 AM
Please Sir,
Tell me how to read
show process cpu history (it will display a graphic so you will be able to analize by second, minute or hour)
I tried this command got graph but i can not understand.......please explain me sir
- Mark as New
- Bookmark
- Subscribe
- Mute
- Subscribe to RSS Feed
- Permalink
- Report Inappropriate Content
07-24-2017 09:48 AM
Hi my friend, sure
You will see 3 graphics,
- the last 1 minute
- the last 1 hours
- the last 72 hours
First graphic is useful to know the current behavior, for example on this picture you will see some spikes to 40% and then it goes to 10% or less, basically there was some process who increased the CPU to 40, the first spike has a duration of 10 second.
0__ 5__ 1__1__2 __2__3__3__4__4.... (for the first graphic the interval highlighted in blue represent the duration, at the 1st graphic each interval is 5 seconds, in the 2nd graphic represent 5 minutes, in the 3rd graphic is represented with 5 hours.

Other example:
The graphic will be moving from left to right side.
>> Marcar como útil o contestado, si la respuesta resolvió la duda, esto ayuda a futuras consultas de otros miembros de la comunidad. <<
Discover and save your favorite ideas. Come back to expert answers, step-by-step guides, recent topics, and more.
New here? Get started with these tips. How to use Community New member guide