- Cisco Community
- Technology and Support
- Networking
- Switching
- Are they both running same
- Subscribe to RSS Feed
- Mark Topic as New
- Mark Topic as Read
- Float this Topic for Current User
- Bookmark
- Subscribe
- Mute
- Printer Friendly Page
HIGH CPU CATALYST 3560E 12.2(35)SE5
- Mark as New
- Bookmark
- Subscribe
- Mute
- Subscribe to RSS Feed
- Permalink
- Report Inappropriate Content
01-09-2015 03:15 AM - edited 03-07-2019 10:09 PM
Hi!
I have 4 x 3560E like distribution switches. One of them has high cpu but I not find the origin, the problem started suddenly.
show processes cpu sorted | exclude 0.00
CPU utilization for five seconds: 49%/39%; one minute: 47%; five minutes: 48%
PID Runtime(ms) Invoked uSecs 5Sec 1Min 5Min TTY Process
87 854198479 100776372 8476 1.27% 1.29% 1.28% 0 hpm counter proc
48 3681037982589038758 0 0.63% 0.57% 0.59% 0 RedEarth Tx Mana
68 183197153015583998 0 0.63% 0.77% 0.76% 0 HLFM address lea
171 6860242164031100540 0 0.63% 0.32% 0.32% 0 Spanning Tree
124 342746053 20371837 16824 0.47% 0.35% 0.35% 0 HQM Stack Proces
84 6304248301631366297 386 0.47% 0.95% 0.98% 0 hpm main process
220 23309 7764 3002 0.31% 0.13% 0.03% 1 Virtual Exec
116 7791506762874627896 0 0.15% 0.34% 0.36% 0 Hulc LED Process
138 135574568 100776380 1345 0.15% 0.08% 0.08% 0 PI MATM Aging Pr
All i can find is sw forwarding counters are increasing, while int the others 3560E sw forwarding counters are 0:
show controllers cpu-interface | i sw forwarding
sw forwarding 581473572 0 0 0 0
I don't know why, any idea?
- Labels:
-
Other Switching
- Mark as New
- Bookmark
- Subscribe
- Mute
- Subscribe to RSS Feed
- Permalink
- Report Inappropriate Content
01-09-2015 04:00 AM
Hello,
Does the CPU spike at all higher than 60%? by looking at your output last 5 mins at 48% seems normal to me, but of course it is not true representation of the spikes that could occur. Secondly, i would strongly recommend upgrading to 12.2(55) SE9
I've found below which might explain the counters and high CPU. If you are doing routing on this device, perhaps look at getting routing table smaller, if it is fairly large, or short term, changing the SDM template to be more in favour of routing.
IdIdentifying Packets Punted from the Switch Hardware
As part of normal Layer 3 switch operation, when the IP route is not programmed into the switch hardware, the hardware punts IP packets to the CPU for IP routing. Punting occasional IP packets to the CPU is normal and expected, but if too many IP packets are punted, the CPU becomes too busy.
The switch counts every IP packet that the hardware punts to the CPU for IP routing. You can use the show controllers cpu privileged EXEC command to see the number of packets put into each CPU receive queue. When the switch hardware is punting packets, the row named sw forwarding is incrementing. Enter the command several times to see if the counts for sw forwarding are rapidly incrementing.
Switch# show controllers cpu-interface
ASIC Rxbiterr Rxunder Fwdctfix Txbuflos Rxbufloc Rxbufdrain
-------------------------------------------------------------------------
ASIC0 0 0 0 0 0 0
ASIC1 0 0 0 0 0 0
cpu-queue-frames retrieved dropped invalid hol-block stray
----------------- ---------- ---------- ---------- ---------- ----------
rpc 2811788 0 0 0 0
stp 944641 0 0 0 0
ipc 280645 0 0 0 0
routing protocol 813536 0 0 0 0
L2 protocol 8787 0 0 0 0
remote console 2808 0 0 0 0
sw forwarding 65614320 0 0 0 0
host 25 0 0 0 0
broadcast 794570 0 0 0 0
cbt-to-spt 0 0 0 0 0
igmp snooping 18941 0 0 0 0
icmp 0 0 0 0 0
logging 0 0 0 0 0
rpf-fail 0 0 0 0 0
dstats 0 0 0 0 0
cpu heartbeat 1717274 0 0 0 0
You can also use the show platform ip unicast statistics privileged EXEC to show the same information about punted packets. The punted IP packets are counted as CPUAdj, shown in bold in this example.
Switch# show platform ip unicast statistics
Global Stats:
HWFwdLoc:0 HWFwdSec:0 UnRes:0 UnSup:0 NoAdj:0
EncapFail:0 CPUAdj:1344291253 Null:0 Drop:0
Prev Global Stats:
HWFwdLoc:0 HWFwdSec:0 UnRes:0 UnSup:0 NoAdj:0
EncapFail:0 CPUAdj:1344291253 Null:0 Drop:0
These statistics are updated every 2 to 3 seconds. Enter the command multiple times to see the change in the CPUAdj counts. When the CPUAdj counts are rapidly incrementing, many IP packets are being forwarded to the CPU for IP routing.
- Mark as New
- Bookmark
- Subscribe
- Mute
- Subscribe to RSS Feed
- Permalink
- Report Inappropriate Content
01-09-2015 05:05 AM
Hi!
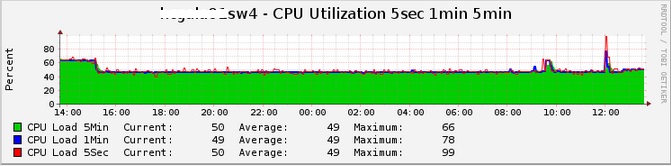
Yes I have to update ios...look at my graphs in sw4 (bad) and sw1 (good).

I saw this article too but I ain't doing routing on these devices. I have two 4506E for routing
Thanks!
- Mark as New
- Bookmark
- Subscribe
- Mute
- Subscribe to RSS Feed
- Permalink
- Report Inappropriate Content
01-09-2015 06:35 AM
Are they both running same version of IOS. Any config changes recently or anything new on the network, like multicast. Any frequent polling via SNMP? Any ACL's being hit frequently?
Perhaps schedule a reboot of this switch out of hours and see if we get the same. Im not experienced enough to troubleshoot exact CPU root cause issues. Maybe someone else here or Cisco TAC team can help further.
- Mark as New
- Bookmark
- Subscribe
- Mute
- Subscribe to RSS Feed
- Permalink
- Report Inappropriate Content
01-11-2015 11:51 PM
Same IOS, just added to vlan 1 on all swhitches the commands:
no ip redirects
no ip unreachables
no ip route-cache
Yes to polling via SNMP, for both switches. SNMP polling are activated since long time.
No ACL on devices.
I will continue searching for the cause
Thanks!
- Mark as New
- Bookmark
- Subscribe
- Mute
- Subscribe to RSS Feed
- Permalink
- Report Inappropriate Content
01-13-2015 11:29 PM
Post the output to the following commands:
1. sh version;
2. sh proc cpu sorted | ex 0.00
- Mark as New
- Bookmark
- Subscribe
- Mute
- Subscribe to RSS Feed
- Permalink
- Report Inappropriate Content
01-13-2015 11:35 PM
1:
sh ver
Cisco IOS Software, C3560E Software (C3560E-UNIVERSAL-M), Version 12.2(35)SE5, RELEASE SOFTWARE (fc1)
Copyright (c) 1986-2007 by Cisco Systems, Inc.
Compiled Thu 19-Jul-07 17:18 by nachen
Image text-base: 0x00003000, data-base: 0x01600000
ROM: Bootstrap program is C3560E boot loader
BOOTLDR: C3560E Boot Loader (C3560E-HBOOT-M) Version 12.2(44r)SE3, RELEASE SOFTWARE (fc3)
hcgala01sw4 uptime is 3 years, 13 weeks, 2 days, 22 hours, 49 minutes
System returned to ROM by power-on
System restarted at 12:31:15 ES Thu Oct 13 2011
System image file is "flash:c3560e-universal-mz.122-35.SE5/c3560e-universal-mz.122-35.SE5.bin"
License Level: ipbase Type: Permanent
Next reboot license Level: ipbase
cisco WS-C3560E-48TD (PowerPC405) processor (revision F0) with 122880K/8184K bytes of memory.
Processor board ID FDO1339R3DV
Last reset from power-on
1 Virtual Ethernet interface
1 FastEthernet interface
52 Gigabit Ethernet interfaces
2 Ten Gigabit Ethernet interfaces
The password-recovery mechanism is enabled.
512K bytes of flash-simulated non-volatile configuration memory.
Base ethernet MAC Address : 00:27:0C:97:4D:00
Motherboard assembly number : 73-11179-13
Motherboard serial number : FDO13400G9D
Model revision number : F0
Motherboard revision number : A0
Model number : WS-C3560E-48TD-S
Daughterboard assembly number : 800-29737-01
Daughterboard serial number : FDO13380TSB
System serial number : FDO1339R3DV
Top Assembly Part Number : 800-28930-01
Top Assembly Revision Number : C0
Version ID : V03
CLEI Code Number : COMSC00ARB
Hardware Board Revision Number : 0x00
Switch Ports Model SW Version SW Image
------ ----- ----- ---------- ----------
* 1 54 WS-C3560E-48TD 12.2(35)SE5 C3560E-UNIVERSAL-M
2:
sh proc cpu sorted | ex 0.00
CPU utilization for five seconds: 48%/38%; one minute: 48%; five minutes: 47%
PID Runtime(ms) Invoked uSecs 5Sec 1Min 5Min TTY Process
87 861315439 101185856 8512 0.95% 1.25% 1.30% 0 hpm counter proc
84 6363564521638535676 388 0.79% 1.06% 1.00% 0 hpm main process
48 3725535562599459494 0 0.63% 0.67% 0.69% 0 RedEarth Tx Mana
124 344989468 20455236 16865 0.47% 0.39% 0.37% 0 HQM Stack Proces
171 6876511734034440640 0 0.47% 0.33% 0.33% 0 Spanning Tree
68 230766633027696958 0 0.31% 0.77% 0.77% 0 HLFM address lea
35 72345659 101292306 714 0.31% 0.12% 0.12% 0 Per-Second Jobs
116 7821432482886540139 0 0.15% 0.35% 0.33% 0 Hulc LED Process
69 1137483 101185870 11 0.15% 0.04% 0.01% 0 HLFM aging proce
233 91029441 72320752 1258 0.15% 0.12% 0.02% 0 SNMP ENGINE
138 136250764 101185864 1346 0.15% 0.09% 0.10% 0 PI MATM Aging Pr
- Mark as New
- Bookmark
- Subscribe
- Mute
- Subscribe to RSS Feed
- Permalink
- Report Inappropriate Content
01-13-2015 11:56 PM
Yes I have to update ios
Upgrade to 12.2(55)SE9 and try again. Give the appliance around one day to "stabilize" before taking a peek at the CPU again.
- Mark as New
- Bookmark
- Subscribe
- Mute
- Subscribe to RSS Feed
- Permalink
- Report Inappropriate Content
04-01-2015 12:13 AM
Cisco TAC helped with another problem about layer 2 loops. That was the problem that provoked high CPU on the switch. Once the problematic mac were dropped everything works fine

XXXXXXXX#sh mac address-table address d4c9.efe0.c182
Unicast Entries
vlan mac address type protocols port
---------+---------------+--------+---------------------+-------------------------
20 d4c9.efe0.c182 dynamic ip,ipx,assigned,other GigabitEthernet3/2 (wrong)
96 d4c9.efe0.c182 dynamic ip,ipx,assigned,other GigabitEthernet3/2 (wrong)
97 d4c9.efe0.c182 dynamic ip,ipx,assigned,other GigabitEthernet3/23 (right)
XXXXXXX(config)#mac-address-table dynamic d4c9.efe0.c182 vlan 20 drop
XXXXXXX(config)#mac-address-table dynamic d4c9.efe0.c182 vlan 96 drop
XXXXXXXX#sh mac address-table address d4c9.efe0.c182
Unicast Entries
vlan mac address type protocols port
---------+---------------+--------+---------------------+-------------------------
97 d4c9.efe0.c182 dynamic ip,ipx,assigned,other GigabitEthernet3/23
We had to drop it because clear mac addres command didn't work.
Thanks everybody
- Mark as New
- Bookmark
- Subscribe
- Mute
- Subscribe to RSS Feed
- Permalink
- Report Inappropriate Content
04-01-2015 10:44 AM
Hi Jose,
Glad to see issue already resolved.
You can always take a look at the below output
CPU utilization for five seconds: 49%/39%;
Toptal cpu is 49% and out of that 39% is due to interrupt - Most of the time it indicates that there is some traffic being punted to CPU . In your case it seemed mac flap, but some times there are traffic with ip options, lot of invalid arp etc..
Hope this helps you in future.
Thanks,
Madhu.
Discover and save your favorite ideas. Come back to expert answers, step-by-step guides, recent topics, and more.
New here? Get started with these tips. How to use Community New member guide
