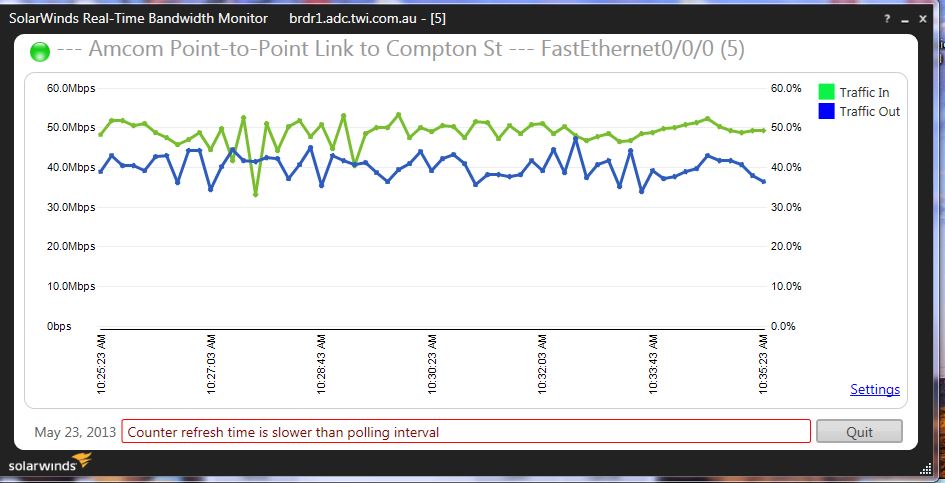
This graph is not measuring throughput on your Internet connection, it's measuring throughput on the FastEthernet connection.
The green line is traffic IN (around 50Mbps, or about 50% of capacity), the blue line is traffic OUT (around 40Mbps, or about 40% of capacity).
If your intent is to monitor traffic on the Internet connection of the router, be sure to configure the monitor with the external IP Address, so it monitors that interface, rather than the internal (100Mb/sec, FastEthernet) interface.
For additional assistance with the SolarWinds Real-Time Bandwidth Monitor, please post in the Thwack support forum for the tool.