- Cisco Community
- Technology and Support
- Networking
- Cisco Catalyst Center
- Re: How to configure Cat3650 for DNA Center Network Assurance
- Subscribe to RSS Feed
- Mark Topic as New
- Mark Topic as Read
- Float this Topic for Current User
- Bookmark
- Subscribe
- Mute
- Printer Friendly Page
")
- Mark as New
- Bookmark
- Subscribe
- Mute
- Subscribe to RSS Feed
- Permalink
- Report Inappropriate Content
04-26-2022 11:31 PM
As automatic network assurance provisioning is not available on DNA Center for Cat3650, I am wondering whether it is possible to configure it manually to stream assurance/telemetry data to DNAC. I suppose some sort of netflow configuration should make sense but after enabling some common sense netflow collection and export on the switch I cannot see anything about the potentially collected data in DNAC. I've found a guide which answers this question regarding WLCs, but nothing about ethernet switches.
Solved! Go to Solution.
- Labels:
-
Cisco DNA Assurance
Accepted Solutions
- Mark as New
- Bookmark
- Subscribe
- Mute
- Subscribe to RSS Feed
- Permalink
- Report Inappropriate Content
05-05-2022 09:00 AM
Turned out that everything was fine, but DNAC is only collecting Client Health(Device Tracking) data on non-trunk interface. In this case all devices in the device-tracking database was learnt on a trunk port, that's why nothing was shown in DNAC. After configuring an access port with a client connected to it data has appeared on DNAC
- Mark as New
- Bookmark
- Subscribe
- Mute
- Subscribe to RSS Feed
- Permalink
- Report Inappropriate Content
04-27-2022 04:43 AM
Hi
Cisco switch 3650 is compatible with DNAC. You can chech the compatibility Matrix here:
https://www.cisco.com/c/dam/en/us/td/docs/Website/enterprise/dnac_compatibility_matrix/index.html
Make sure you have the latest version on switch or accordingly with your DNAC.
The process of onborad device on DNAC when not fabric, is as follow. You need to discovery the device using some credentials like SNMP, SSH, Web, netconf.
After the device show up on the Plug and Play tab, you can claim the device and associate it to a site. Associate to a site or floor is mandatory to benefit from Assurance.
You can also perform PnP process. When the PNP agent is running on the switch, if you plug the switch in a port with DHCP available, the switch will try to resolve the url "pnpntpserver.domain.com". If you add in your DNS the DNAC Ip address, then the switch can automact discovery the DNAC server.
- Mark as New
- Bookmark
- Subscribe
- Mute
- Subscribe to RSS Feed
- Permalink
- Report Inappropriate Content
04-27-2022 05:23 AM
Hi Flavio,
thank you very much for your response!
I have performed those steps. The next phase is to enable telemetry at Inventory->Action->Telemetry->Enable Application Telemetry. However this item is grayed out in the menu(see attached). TAC has already told me that automatic Telemetry enablement is not supported in DNAC for 3650, that's why I am looking for a way to enable it manually.
I have already enabled netflow collection with export to DNAC on the 3650 manually, but the Assurance-Dashboards-Health-Application page is still empty, so something must be still missing.
- Mark as New
- Bookmark
- Subscribe
- Mute
- Subscribe to RSS Feed
- Permalink
- Report Inappropriate Content
04-27-2022 05:45 AM
What is your switch IOS version?
- Mark as New
- Bookmark
- Subscribe
- Mute
- Subscribe to RSS Feed
- Permalink
- Report Inappropriate Content
04-27-2022 06:18 AM
16.12.07
- Mark as New
- Bookmark
- Subscribe
- Mute
- Subscribe to RSS Feed
- Permalink
- Report Inappropriate Content
04-27-2022 06:30 AM
Make sure you have all the necessary requirement on switch side. This doc was related to your version Gibraltar.
I believe you need to create a credential template on the DNAC with netconf port 830 and make the DNAC connect the switch using netconf port and credentials.
After that, try to go back to the DNAC Telelemetry and see if the switch is not grayed anymore.
Verify this:
Prerequisites for Model-Driven Telemetry
- Knowledge of YANG is needed to understand and define the data that is required when using telemetry.
- Knowledge of XML, XML namespaces, and XML XPath.
- Knowledge of standards and principles defined by the IETF telemetry specifications.
- The urn:ietf:params:netconf:capability:notification:1.1 capability must be listed in hello messages. This capability is -advertised only on devices that support IETF telemetry.
- NETCONF-YANG must be configured and running on the device.
Device# show platform software yang-management process
confd : Running
nesd : Running
syncfd : Running
ncsshd : Running
dmiauthd : Running
nginx : Running
ndbmand : Running
pubd : Running
gnmib : Running
NETCONF-Specific Prerequisites
- Knowledge of NETCONF and how to use it, including:
- Establishing a NETCONF session.
- Sending and receiving hello and capabilities messages.
- Sending and receiving YANG XML RPCs over the established NETCONF session. For more information, see the - - - Configure NETCONF/YANG and Validate Example for Cisco IOS XE 16.x Platforms document.
Device:~ USER1$ ssh -s cisco1@172.16.167.175 -p 830 netconf
- Mark as New
- Bookmark
- Subscribe
- Mute
- Subscribe to RSS Feed
- Permalink
- Report Inappropriate Content
04-27-2022 08:21 AM
turned out that Netconf-yang was not configured with this device in DNAC. Now I have configured it (under Edit Device), validation gave the "green tick" for netconf as well, I've clicked on Update, then waited the device to resync, which was successful. However, "Enable Application Telemetry" is still greyed out, and in the inventory Application Telemetry is shown as Not provisioned.
- Mark as New
- Bookmark
- Subscribe
- Mute
- Subscribe to RSS Feed
- Permalink
- Report Inappropriate Content
04-27-2022 08:48 AM
BTW this is the response I have received from TAC:
"C3850 is indeed not supported for application telemetry. The supported devices for application telemetry can be found in the following link: https://www.cisco.com/c/en/us/td/docs/cloud-systems-management/network-automation-and-management/dna-center-assurance/2-2-3/b_cisco_dna_assurance_2_2_3_ug/b_cisco_dna_assurance_2_2_3_ug_chapter_01000.html#Cisco_Reference.dita_d6949700-dee4-4d2d-ac2e-... "
So my aim here is to understand whether it is possible to collect and analyze standard netflow data from C3650/3850 with DNAC. DNAC configures its own IP address as netflow export target during the Assign/Provision step(which suggests that this is supported), but I cannot see that netflow data anywhere on the DNAC GUI.
(and I cannot even see netflow data in the same DNAC from a WLC9800 which was configured manually for telemetry based on this guide )
- Mark as New
- Bookmark
- Subscribe
- Mute
- Subscribe to RSS Feed
- Permalink
- Report Inappropriate Content
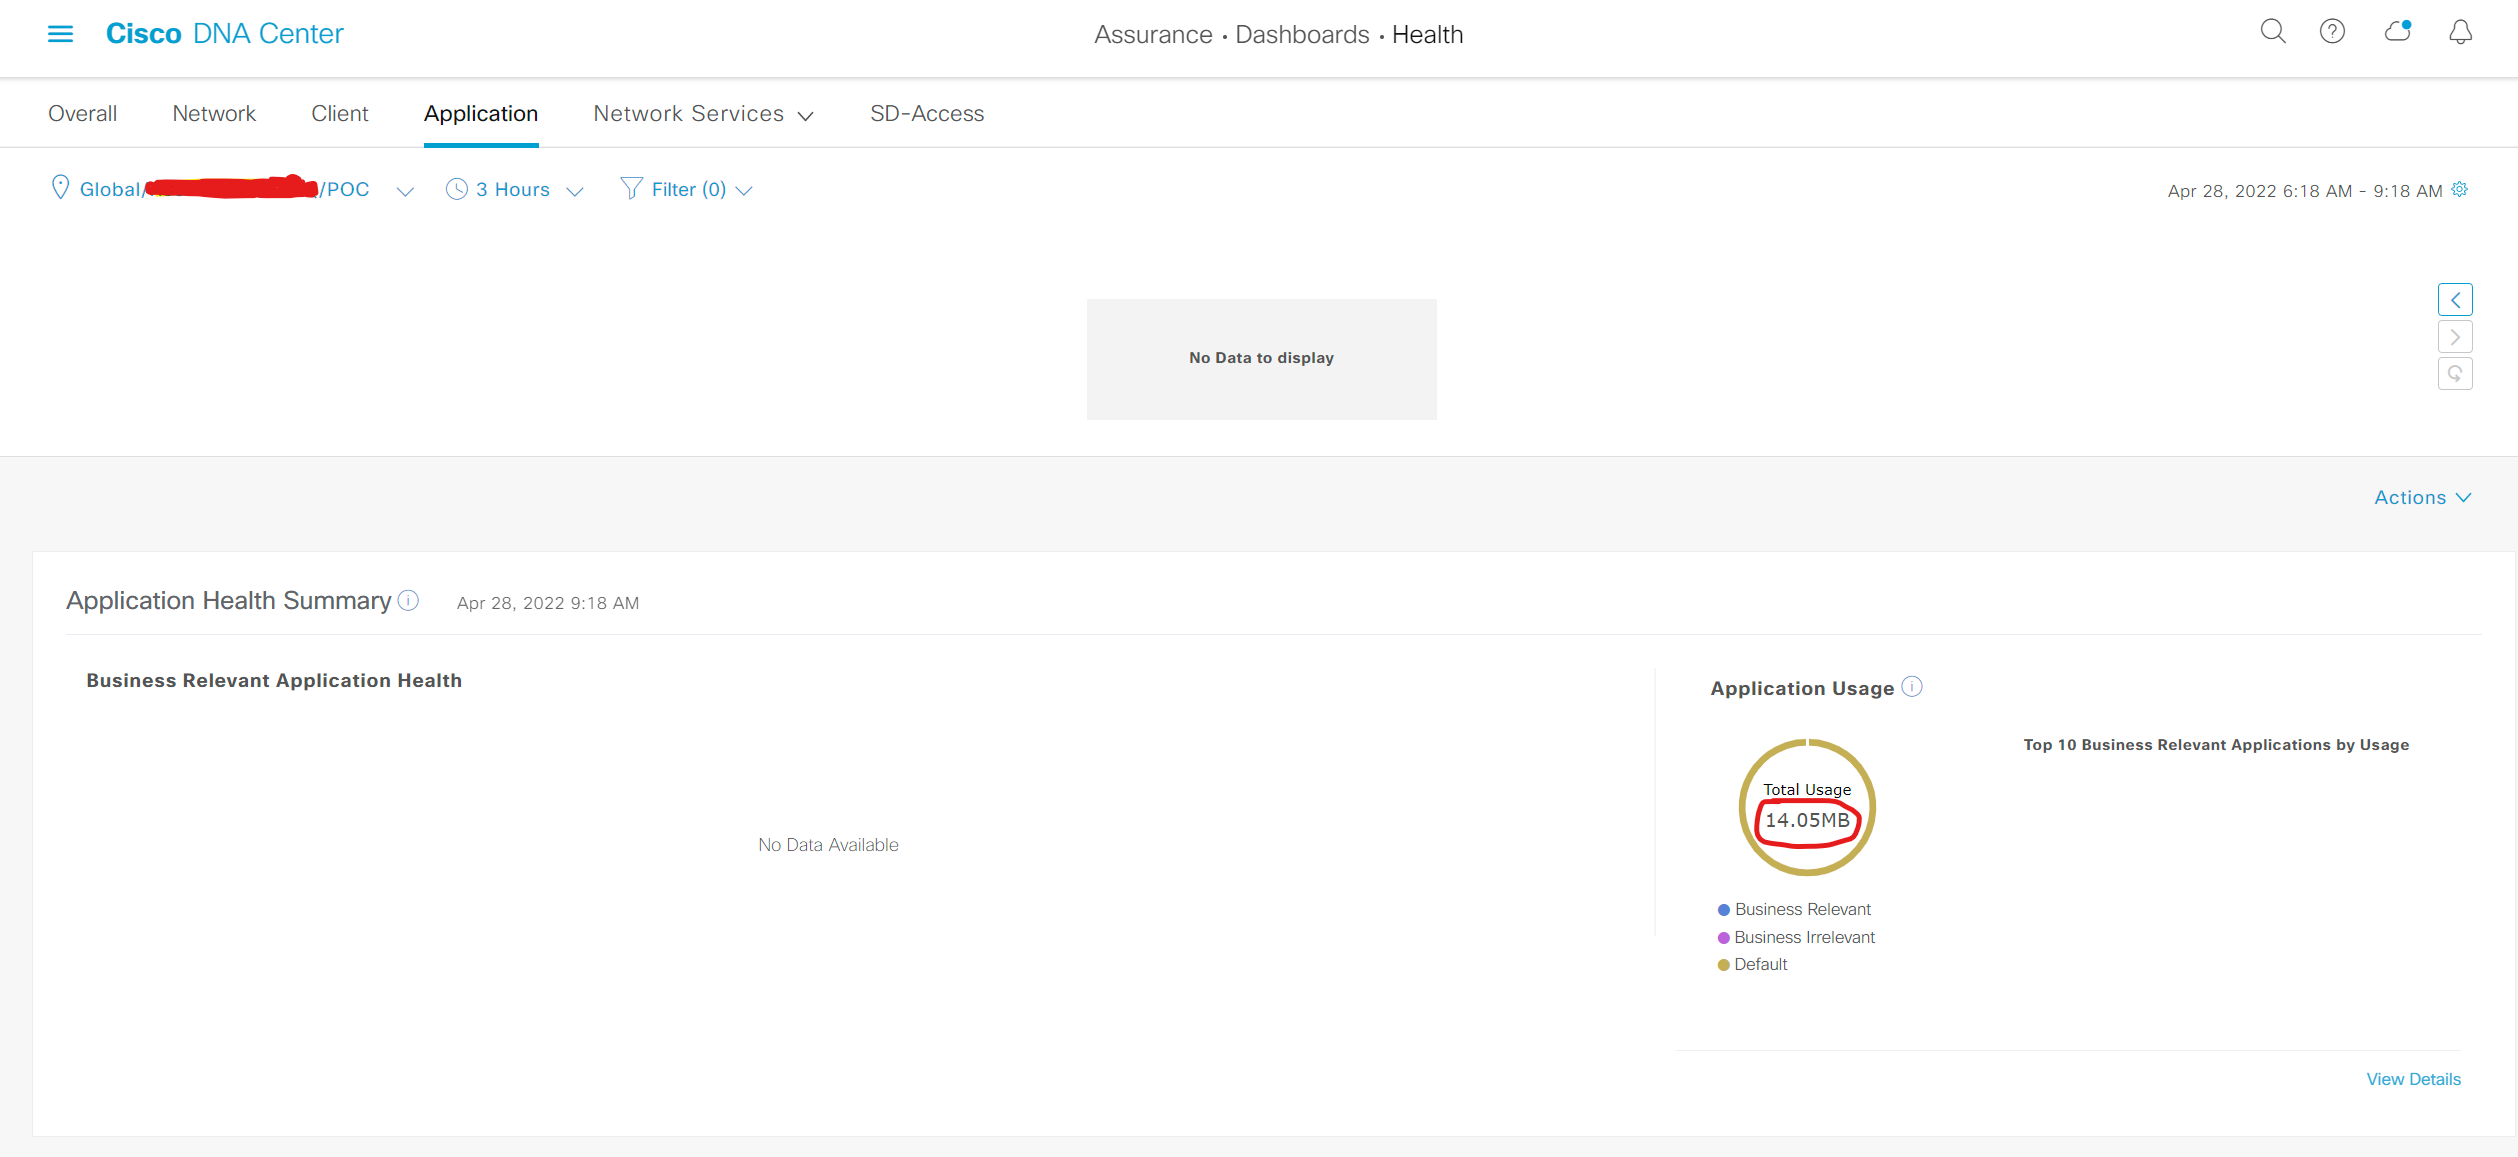
04-28-2022 12:43 AM
After some time(half a day or so) some netflow data has appeared on the Application Health Dashboard. However the data shown is not very useful (pls. see attached). Any hint to make it more useful? Some DNAC side changes or maybe a different netflow record configuration on the 3650?
- Mark as New
- Bookmark
- Subscribe
- Mute
- Subscribe to RSS Feed
- Permalink
- Report Inappropriate Content
04-28-2022 01:56 AM
I think I have found a solution: I've checked on a 9200 what configuration was deployed by DNAC in the Enable Application Telemetry step, then configured this manually on the 3650. Now the data shown by DNAC makes much more sense.
Here is the template:
flow record dnacrecord
match ipv4 version
match ipv4 protocol
match application name
match connection client ipv4 address
match connection server ipv4 address
match connection server transport port
match flow observation point
collect timestamp absolute first
collect timestamp absolute last
collect flow direction
collect connection initiator
collect connection client counter packets long
collect connection client counter bytes network long
collect connection server counter packets long
collect connection server counter bytes network long
collect connection new-connections
!
!
flow record dnacrecord_v6
match ipv6 version
match ipv6 protocol
match application name
match connection client ipv6 address
match connection server ipv6 address
match connection server transport port
match flow observation point
collect timestamp absolute first
collect timestamp absolute last
collect flow direction
collect connection initiator
collect connection client counter packets long
collect connection client counter bytes network long
collect connection server counter packets long
collect connection server counter bytes network long
collect connection new-connections
!
flow exporter dnacexporter
destination <IP address of DNAC>
source <source interface>
transport udp 6007
export-protocol ipfix
option interface-table timeout 300
option vrf-table timeout 300
option sampler-table
option application-table timeout 300
option application-attributes timeout 300
!
!
flow monitor dnacmonitor
exporter dnacexporter
cache timeout inactive 10
cache timeout active 60
record dnacrecord
!
!
flow monitor dnacmonitor_v6
exporter dnacexporter
cache timeout inactive 10
cache timeout active 60
record dnacrecord_v6
!
interface <interface_name>
ip flow monitor dnacmonitor input
ip flow monitor dnacmonitor output
- Mark as New
- Bookmark
- Subscribe
- Mute
- Subscribe to RSS Feed
- Permalink
- Report Inappropriate Content
04-28-2022 02:24 AM
Congratullation and thanks for sharing.
- Mark as New
- Bookmark
- Subscribe
- Mute
- Subscribe to RSS Feed
- Permalink
- Report Inappropriate Content
04-28-2022 06:16 AM
Application Health works now more or less, but Client page under (Assurance*Dashboards*Health) is still empty.
I've tried to compare the configuration of the 3650 with a 9300 which has Client telemetry configured by DNAC automation(and works), as far as I can tell relevant parts are identical.
I can also see quite a lot of client devices in the output of "sh device-tracking database" on 3650 CLI, but Client page(Assurance*Dashboards*Health) is empty.
Any idea what might be missing?
- Mark as New
- Bookmark
- Subscribe
- Mute
- Subscribe to RSS Feed
- Permalink
- Report Inappropriate Content
05-05-2022 09:00 AM
Turned out that everything was fine, but DNAC is only collecting Client Health(Device Tracking) data on non-trunk interface. In this case all devices in the device-tracking database was learnt on a trunk port, that's why nothing was shown in DNAC. After configuring an access port with a client connected to it data has appeared on DNAC
Discover and save your favorite ideas. Come back to expert answers, step-by-step guides, recent topics, and more.
New here? Get started with these tips. How to use Community New member guide