- Cisco Community
- Technology and Support
- Networking
- Network Management
- 64bitRxUtilization error message on Graph it - No Such Instance
- Subscribe to RSS Feed
- Mark Topic as New
- Mark Topic as Read
- Float this Topic for Current User
- Bookmark
- Subscribe
- Mute
- Printer Friendly Page
- Mark as New
- Bookmark
- Subscribe
- Mute
- Subscribe to RSS Feed
- Permalink
- Report Inappropriate Content
11-27-2013 06:22 AM
Hi
When I use graph it to monitor the utilization of one of our WAN interfaces I get the following error:
No Such Instance - The specified instance is not available
When I snmpwalk both ifHCInOctets and ifHighSpeed I get the correct values - this is a gigbait interface. For some reason HUM is giving this error when I try to do a graph with our bandwidth usage (Graph IT) - I know I may use Cacti but I would like to use LMS to do this job.
[U-SRVLMS/root-ade logs]# snmpwalk -v 2c -m ALL -c xxxxxxx 172.31.34.254 ifhcinoctets
IF-MIB::ifHCInOctets.1 = Counter64: 0
IF-MIB::ifHCInOctets.551 = Counter64: 14381089
IF-MIB::ifHCInOctets.559 = Counter64: 5813547957
IF-MIB::ifHCInOctets.10101 = Counter64: 0
IF-MIB::ifHCInOctets.10102 = Counter64: 0
IF-MIB::ifHCInOctets.10103 = Counter64: 0
IF-MIB::ifHCInOctets.10104 = Counter64: 0
IF-MIB::ifHCInOctets.10105 = Counter64: 0
IF-MIB::ifHCInOctets.10106 = Counter64: 0
IF-MIB::ifHCInOctets.10107 = Counter64: 0
IF-MIB::ifHCInOctets.10108 = Counter64: 0
IF-MIB::ifHCInOctets.10109 = Counter64: 0
IF-MIB::ifHCInOctets.10110 = Counter64: 7836856738
[U-SRVLMS/root-ade logs]# snmpwalk -v 2c -m ALL -c xxxxxxx 172.31.34.254 ifhighspeed
IF-MIB::ifHighSpeed.1 = Gauge32: 1000
IF-MIB::ifHighSpeed.551 = Gauge32: 1000
IF-MIB::ifHighSpeed.559 = Gauge32: 1000
IF-MIB::ifHighSpeed.10101 = Gauge32: 10
IF-MIB::ifHighSpeed.10102 = Gauge32: 10
IF-MIB::ifHighSpeed.10103 = Gauge32: 10
IF-MIB::ifHighSpeed.10104 = Gauge32: 10
IF-MIB::ifHighSpeed.10105 = Gauge32: 10
IF-MIB::ifHighSpeed.10106 = Gauge32: 10
IF-MIB::ifHighSpeed.10107 = Gauge32: 10
IF-MIB::ifHighSpeed.10108 = Gauge32: 10
IF-MIB::ifHighSpeed.10109 = Gauge32: 10
IF-MIB::ifHighSpeed.10110 = Gauge32: 1000
IF-MIB::ifHighSpeed.10501 = Gauge32: 10000
This a 3560C switch running this image:
Is there something I am missing?
Switch Ports Model SW Version SW Image
------ ----- ----- ---------- ----------
* 1 10 WS-C3560CG-8TC-S 15.0(2)SE3 C3560c405ex-UNIVERSALK9-M
Best regards
Isaac
Solved! Go to Solution.
- Labels:
-
Network Management
Accepted Solutions
- Mark as New
- Bookmark
- Subscribe
- Mute
- Subscribe to RSS Feed
- Permalink
- Report Inappropriate Content
11-28-2013 11:45 PM
OK, than please look at the poller, the interface will be measured. If you see error and noSuchInstance as reason than this not a false-positive, than the device does not support 64Bit counter in the IF-MIB (high resolution extentions). This could be the case at older devices or older IOS/CatOS.
Also in case of using SNMPv1 for the device instead of v2c, the standard 32Bit counters in place of the 64Bit counters will be addressed. So the Poller backend (32Bit counter) and Graph-IT frontend (64 Bit counters hard coded only) doesnt fit together.
32bit counters:
+ everey device supports ths
- but just 120MBit/s could be covered at 5minute poll interval an having counter overflow logic implemented
- LMS Graph-IT portlet cant adress 32bit counters
64:
+ all maximal possible traffic at lowest poll interval can be covered
- may be worst case lots of devices in your network doesnt support hres IF-MIB extension
Please google for both OID's and try out with a snmpwalk. Search for snmpwalk binary below the CSCOpx folder.
The noSuchInstance in GraphIT's config mode will be shown allways, also in good conditions.
Steffen
- Mark as New
- Bookmark
- Subscribe
- Mute
- Subscribe to RSS Feed
- Permalink
- Report Inappropriate Content
11-28-2013 12:44 PM
Hi Isaac,
No Such Instance is shown allways in configuration mode. You can reach the instance in GraphIT only, if you configured a poller with the right instance anyway. If you check the graph it will wrk despite this false positive.
Steffen
- Mark as New
- Bookmark
- Subscribe
- Mute
- Subscribe to RSS Feed
- Permalink
- Report Inappropriate Content
11-28-2013 02:21 PM
Hello Steffen
Thank you for your answer.
I am testing with a Graph and no info is shown. I think the issue is related with the fact that when I pool ifHCinoctets and ifhcoutoctets the poller fails.
Have no idea why though
Will keep investigating will keep posting.
Thanks for your help
Isaac
- Mark as New
- Bookmark
- Subscribe
- Mute
- Subscribe to RSS Feed
- Permalink
- Report Inappropriate Content
11-28-2013 02:33 PM
I am having the same issue as posted by Marvin in this thread:
https://supportforums.cisco.com/message/4103496#4103496
But unfortunatly no answer is given there....
- Mark as New
- Bookmark
- Subscribe
- Mute
- Subscribe to RSS Feed
- Permalink
- Report Inappropriate Content
11-28-2013 11:45 PM
OK, than please look at the poller, the interface will be measured. If you see error and noSuchInstance as reason than this not a false-positive, than the device does not support 64Bit counter in the IF-MIB (high resolution extentions). This could be the case at older devices or older IOS/CatOS.
Also in case of using SNMPv1 for the device instead of v2c, the standard 32Bit counters in place of the 64Bit counters will be addressed. So the Poller backend (32Bit counter) and Graph-IT frontend (64 Bit counters hard coded only) doesnt fit together.
32bit counters:
+ everey device supports ths
- but just 120MBit/s could be covered at 5minute poll interval an having counter overflow logic implemented
- LMS Graph-IT portlet cant adress 32bit counters
64:
+ all maximal possible traffic at lowest poll interval can be covered
- may be worst case lots of devices in your network doesnt support hres IF-MIB extension
Please google for both OID's and try out with a snmpwalk. Search for snmpwalk binary below the CSCOpx folder.
The noSuchInstance in GraphIT's config mode will be shown allways, also in good conditions.
Steffen
- Mark as New
- Bookmark
- Subscribe
- Mute
- Subscribe to RSS Feed
- Permalink
- Report Inappropriate Content
12-02-2013 01:04 AM
Hello Steffen
You were right. I have just left the poolers running over the weekend and I have almost no errors. My only issue now is Graphit.
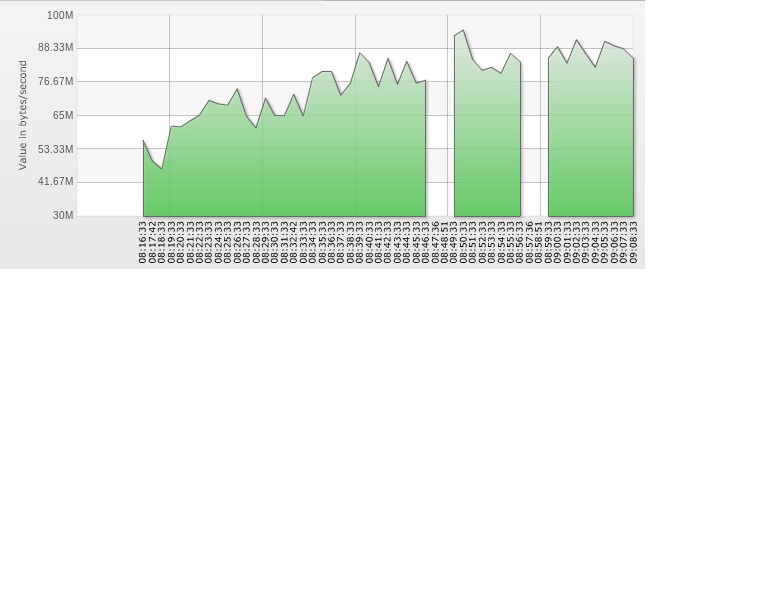
I am pooling one of our devices every 1min and doing a graph that refreshes automaticaly every 60secs. I get though the same error message - also on other graphs.
No Such Instance - The specified instance is not available
Do you know how to troubleshhot Graph IT - I have tried to google that but didn't found nothing that could help me.
Thanks for your help.
Isaac
- Mark as New
- Bookmark
- Subscribe
- Mute
- Subscribe to RSS Feed
- Permalink
- Report Inappropriate Content
12-02-2013 07:10 AM
sorry, dont know how to troubleshoot Graphit portlet in particular. Im afraid that could be done by the developer or someone from TAC only. Generally during I do an action with a LMS gui element and i#ve got into trouble I sort log folder after date and time and watch the logfiles that are changing. If I dont catch the cause, i higher the log level for the logfiles that changed in the relevant time period.dont forget to lower the loglevel after ts.
But in your case, the problem looks more likely for poller issues, because the the portlet makes a dB query only and the gaps are time periods with no data. please check also if there is something that drives down the daemon manager regulary maybe for syncing a self made HA solution or self made backup.
steffen
- Mark as New
- Bookmark
- Subscribe
- Mute
- Subscribe to RSS Feed
- Permalink
- Report Inappropriate Content
12-03-2013 12:34 AM
Hello Steffen
Thank you very much for your inputs.
I will try to check the logs and if the i can't solve it I will open a TAC.
Just one last question. What do you mean with self made HA solution?
Kind regards
Isaac
- Mark as New
- Bookmark
- Subscribe
- Mute
- Subscribe to RSS Feed
- Permalink
- Report Inappropriate Content
12-03-2013 05:00 AM
self made HA solution: something like regulary backup LMS-node-1, sync and restore backup to LMS-node-2 acting as a standby need to restart the daemon manager and cause gaps in graphs....
- Mark as New
- Bookmark
- Subscribe
- Mute
- Subscribe to RSS Feed
- Permalink
- Report Inappropriate Content
12-03-2013 05:03 AM
Hello Steffen
Thank you for the updates.
Will update the thread if I find something more. Today everything is working fine... Strange..
Discover and save your favorite ideas. Come back to expert answers, step-by-step guides, recent topics, and more.
New here? Get started with these tips. How to use Community New member guide