- Cisco Community
- Technology and Support
- Networking
- Network Management
- LMS 4.0 Top panel fault count appears incorrect/unrelated
- Subscribe to RSS Feed
- Mark Topic as New
- Mark Topic as Read
- Float this Topic for Current User
- Bookmark
- Subscribe
- Mute
- Printer Friendly Page
LMS 4.0 Top panel fault count appears incorrect/unrelated
- Mark as New
- Bookmark
- Subscribe
- Mute
- Subscribe to RSS Feed
- Permalink
- Report Inappropriate Content
02-13-2011 11:33 PM
I've been looking at this for a while and it doesn't make sense to me.
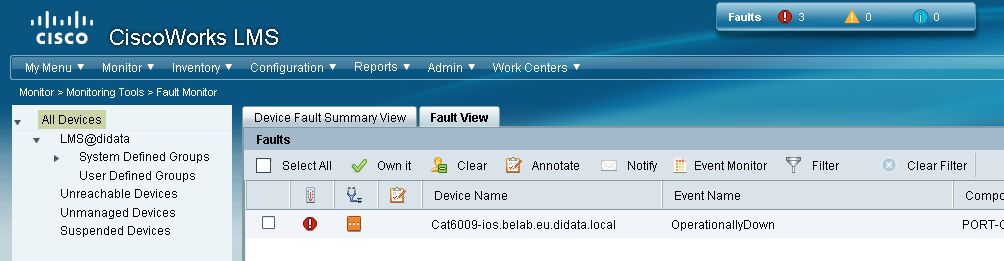
The faults I see in the Fault view don't match with what is shown on top of the page. Right now there are more fault in the top panel, the other day I had 5 informationals in the Fault view and 0 fault in the top panel
I'm admin, can see all devices. No restritions are in place
json view confirms {"criticalCount":"3","informationalCount":"0","warningCount":"0"}
And it stays like this.
How should I diagnose this?
Cheers,
Michel
- Labels:
-
Network Management
- Mark as New
- Bookmark
- Subscribe
- Mute
- Subscribe to RSS Feed
- Permalink
- Report Inappropriate Content
02-16-2011 06:44 AM
I have the same problem, let me know if you find a way to fix this...
- Mark as New
- Bookmark
- Subscribe
- Mute
- Subscribe to RSS Feed
- Permalink
- Report Inappropriate Content
02-17-2011 08:24 AM
No sollution for now.
And it seems the more I look the more inconsistencies I see.

8 duplex issue in campus and 3 in the portlet

I would assume these are based on the same data collection information.
Customer will see this in the near future. And I don't know what I could say about it.
- Mark as New
- Bookmark
- Subscribe
- Mute
- Subscribe to RSS Feed
- Permalink
- Report Inappropriate Content
02-17-2011 11:02 AM
Out of curiosity, on what OS are you running LMS?
I did two install for two different customer recently, one on Win2k3 R2 and one on Win2k8 R2. The install on Win2k3 R2 have no problem, the install on Win2k8 R2 have the incorrect fault count problem, device added with the Device Discovey dont appear in the DCR, ...
- Mark as New
- Bookmark
- Subscribe
- Mute
- Subscribe to RSS Feed
- Permalink
- Report Inappropriate Content
02-17-2011 11:10 AM
I see the fault count issue on 2003 at a customer and also in my lab and on 2008 R2 at another customer.
On an installation on 2008 standard I have not (yet) seen this.
Cheers,
Michel
- Mark as New
- Bookmark
- Subscribe
- Mute
- Subscribe to RSS Feed
- Permalink
- Report Inappropriate Content
02-20-2011 10:43 AM
See this thread for some hints:
- Mark as New
- Bookmark
- Subscribe
- Mute
- Subscribe to RSS Feed
- Permalink
- Report Inappropriate Content
02-20-2011 11:35 AM
Thanks for your reply Joe,
So it is most likely a database issue? I will try this on my lab machine and see if it goes away and hopefully stays away.
I expected the top panel to just do a sort of
"select count(*) from DFMfaults group by severity"
on the same table that would be used to display these faults in the faultview.
Guess I'm naive to think it would be that straight forward. I am ofcourse wondering what may have provoked this difference in count.
In my lab anything may happen but most customer have very stable environments and nobody access the machine other then via the webinterface.
Cheers,
Michel
- Mark as New
- Bookmark
- Subscribe
- Mute
- Subscribe to RSS Feed
- Permalink
- Report Inappropriate Content
02-20-2011 12:50 PM
The code kind of works the way you have said, but the count of events in the table that is used for counting is not the same table that stores the event details. However, in your case, I wonder if what you're seeing is expected. The count in the top panel is that of events, not alerts. You see at east one alert in the Fault Monitor. Click on it, then look at the associated events. That count should equal the count you see in the top info bar.
Discover and save your favorite ideas. Come back to expert answers, step-by-step guides, recent topics, and more.
New here? Get started with these tips. How to use Community New member guide