- Cisco Community
- Technology and Support
- Networking
- Network Management
- Prime LMS 4.1 Alarms problem (lost alarms).
- Subscribe to RSS Feed
- Mark Topic as New
- Mark Topic as Read
- Float this Topic for Current User
- Bookmark
- Subscribe
- Mute
- Printer Friendly Page
")
- Mark as New
- Bookmark
- Subscribe
- Mute
- Subscribe to RSS Feed
- Permalink
- Report Inappropriate Content
11-24-2011 02:07 AM
Hi,
We are currently implementing the new Prime LMS (4.1), and we met some strange problems with the «Alarms» (footer/bottom right).
Under implementation we had a bunch of false positive alerts, so we went in and ticked of all of them to choose «Own it» and «Clear».
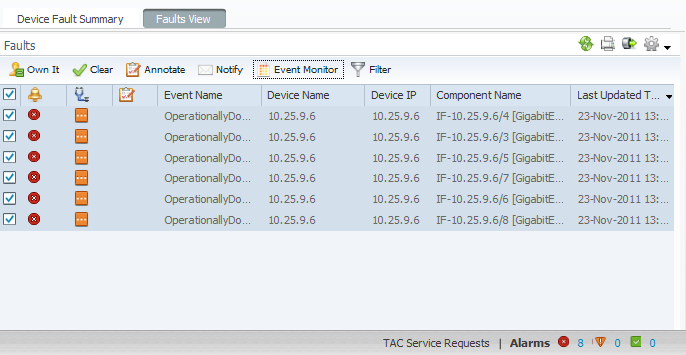
Something happened and the browser crashed, and when opening the browser again and browsing to the “Fault monitor” from “Alarms” could we see that all the alarms was cleared from the view, but LMS was still telling us that there is two alarms (down in the footer/bottom right).
When going into the “Fault monitor” from clicking on “Alarms” we got the “spinning wheel of death”.
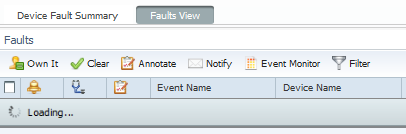
The browser crashes after a while and we have to log in again.
Now, when we have some alarms after rebooting the WLC’s, we get the 6 alarms from interfaces down, but the two remaining alarms it’s talking about is nowhere to be found.
Future more, the browser crashes yet again after a while and we have to log in again.
If we are doing other tasks, and keeping away from the “Fault monitor” everything is working fine.
The browser crash/lms hang occurs only when accessing the “Fault monitor” section.
We have looked everywhere for what is causing this. Something with the two alarms that’s lost in the system keeps the browser/lms to crash. But damned if I can find where to get rid of them / clear them.
Any tip or insight would be wonderful. Thanks in advance
Solved! Go to Solution.
- Labels:
-
Network Management
Accepted Solutions
- Mark as New
- Bookmark
- Subscribe
- Mute
- Subscribe to RSS Feed
- Permalink
- Report Inappropriate Content
11-27-2011 04:36 AM
Hi Marius,
That are 2 issues you have. I've not seen the browser crash in Firefox 8 so far. Luck maybe.
The other issue of the difference in number of errors in the summary view and in the fault monitor is more common. Also seen in 4.0 and 4.01.
Unfortunately I have not (real) found a solution for this. Other than reiniting the DFM databases and rps files.
I've done this once to see the problem reapear 2 days later. A week later it was gone again.
I guess the summary is showing generated info and is not doing a real query on the fault tables. The database are undocumented so it will be hard to repair and it may reappear under "some" circumstances.
Cheers,
Michel
- Mark as New
- Bookmark
- Subscribe
- Mute
- Subscribe to RSS Feed
- Permalink
- Report Inappropriate Content
11-27-2011 05:52 AM
The resource consuption in IE is huge. Seems bettter in FF. Don't run it on the server itself !! (Well unless you doubled the servers specs perhaps)
I thought fault management page is working better in v4.1 than in v4.0. Maybe not....
Cheers,
Michel
- Mark as New
- Bookmark
- Subscribe
- Mute
- Subscribe to RSS Feed
- Permalink
- Report Inappropriate Content
11-27-2011 02:27 AM
What browsers and which versions of those browsers did you try?
The nasty popup to tell you are using a unsupported version has been removed from LMS prime.
Cheers,
Michel
- Mark as New
- Bookmark
- Subscribe
- Mute
- Subscribe to RSS Feed
- Permalink
- Report Inappropriate Content
11-27-2011 03:15 AM
I’ve tried IE9 (the only Prime LMS supported browser I have), FireFox 8.0.1, Opera 11.52 and Chrome 15.0.874.121.

This does not seem to be browser problem, but more like something with the database. Something is hanging in the system, and I don’t know what and where to clear it away.
- Mark as New
- Bookmark
- Subscribe
- Mute
- Subscribe to RSS Feed
- Permalink
- Report Inappropriate Content
11-27-2011 04:36 AM
Hi Marius,
That are 2 issues you have. I've not seen the browser crash in Firefox 8 so far. Luck maybe.
The other issue of the difference in number of errors in the summary view and in the fault monitor is more common. Also seen in 4.0 and 4.01.
Unfortunately I have not (real) found a solution for this. Other than reiniting the DFM databases and rps files.
I've done this once to see the problem reapear 2 days later. A week later it was gone again.
I guess the summary is showing generated info and is not doing a real query on the fault tables. The database are undocumented so it will be hard to repair and it may reappear under "some" circumstances.
Cheers,
Michel
- Mark as New
- Bookmark
- Subscribe
- Mute
- Subscribe to RSS Feed
- Permalink
- Report Inappropriate Content
11-27-2011 05:32 AM
I've tried reinitializing all the DFM databases ( https://supportforums.cisco.com/docs/DOC-8796 ).
Got rid of the two alarms that was false positives, but the "Fault Monitor" is still really sluggish and ends up crashing the browser. :/
- Mark as New
- Bookmark
- Subscribe
- Mute
- Subscribe to RSS Feed
- Permalink
- Report Inappropriate Content
11-27-2011 05:52 AM
The resource consuption in IE is huge. Seems bettter in FF. Don't run it on the server itself !! (Well unless you doubled the servers specs perhaps)
I thought fault management page is working better in v4.1 than in v4.0. Maybe not....
Cheers,
Michel
- Mark as New
- Bookmark
- Subscribe
- Mute
- Subscribe to RSS Feed
- Permalink
- Report Inappropriate Content
11-27-2011 12:25 PM
Thank you for advice. As you were saying;
Everything is working much smoother after reinitializing all of the DFM databases and opening "Fault Monitor"
using FF.
- Mark as New
- Bookmark
- Subscribe
- Mute
- Subscribe to RSS Feed
- Permalink
- Report Inappropriate Content
12-19-2011 06:46 AM
I had a case open concerning the issue that the fault bar reports a wrong number of critical faults. TAC was able to resolve the issue and should publish a patch.
Greetings
Rufer
- Mark as New
- Bookmark
- Subscribe
- Mute
- Subscribe to RSS Feed
- Permalink
- Report Inappropriate Content
12-19-2011 07:14 AM
Thats cool Mathias,
Did TAC give you a bugid?
Did the 'resolution' consist of something else than reiniting the DFM databases ?
Cheers,
Michel
- Mark as New
- Bookmark
- Subscribe
- Mute
- Subscribe to RSS Feed
- Permalink
- Report Inappropriate Content
12-19-2011 07:21 AM
Well it is related to CSCtq07224 but the patch didn't work in our case and we had to execute some weird SQL statements in the DB reader. TAC promised to fix this for 4.2
Not sure if I can publish here what TAC sent me.
- Mark as New
- Bookmark
- Subscribe
- Mute
- Subscribe to RSS Feed
- Permalink
- Report Inappropriate Content
12-19-2011 07:47 AM
Hmm It says first found in version 4.2 in the bugid
I'm interested in the SQL (You may send me a private message if you are willing) but if you post it here put a big
"Don't try this a home" sign with it.
DBreader is nice but be sure to have a backup before you start.
Cheers,
Michel
Discover and save your favorite ideas. Come back to expert answers, step-by-step guides, recent topics, and more.
New here? Get started with these tips. How to use Community New member guide
