- Cisco Community
- Technology and Support
- Networking
- Routing
- CE500 switch high memory utilization - 92%
- Subscribe to RSS Feed
- Mark Topic as New
- Mark Topic as Read
- Float this Topic for Current User
- Bookmark
- Subscribe
- Mute
- Printer Friendly Page
CE500 switch high memory utilization - 92%
- Mark as New
- Bookmark
- Subscribe
- Mute
- Subscribe to RSS Feed
- Permalink
- Report Inappropriate Content
07-12-2010 01:48 AM - edited 03-04-2019 09:01 AM
We have 30 to 40 numbers of CE500 switch used for Voice/Data
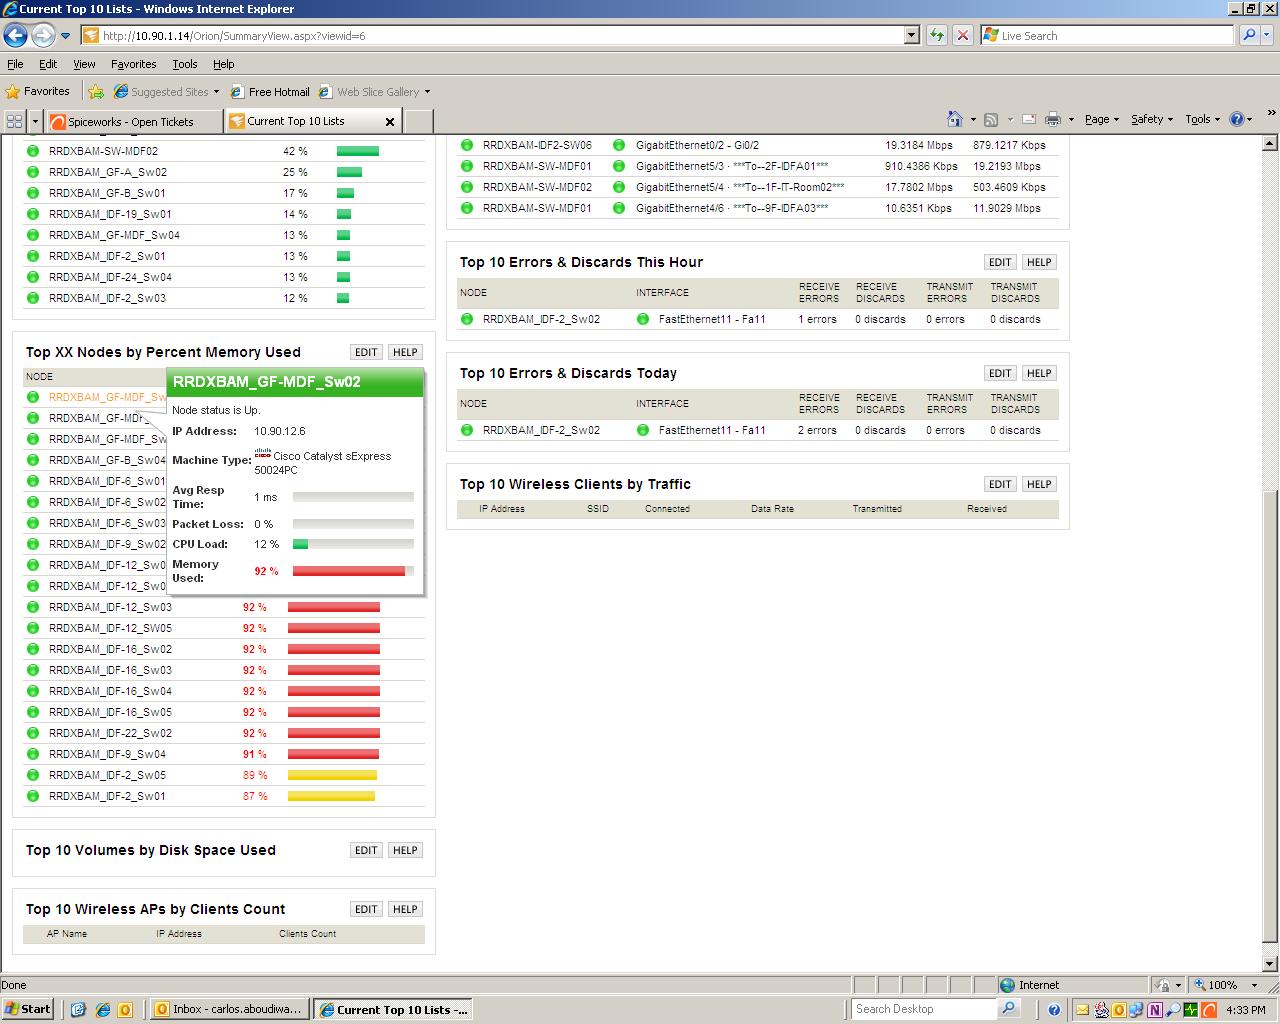
All the CE500 swithes CPU is arround 20% but memory utilization is 92% and more.
Pls. let me know if anyone has any idea, why CE500 memory utilization is high? and how to reduce it.
version is 12.2-25FY
Attached screenshot from monitoring software.
Thanks
- Labels:
-
LAN Switching
- Mark as New
- Bookmark
- Subscribe
- Mute
- Subscribe to RSS Feed
- Permalink
- Report Inappropriate Content
07-12-2010 06:59 AM
Rajesh,
In order to determine what is consuming the processor pool memory, there are a couple of places that you can look. They include:
-show version
-show proc mem (or 'show proc mem sorted')
-show mem allocating-process totals
-show mem sum
All of these commands will help us to determine where the memory is being used, and whether or not that level of utilization is normal for your particular device. Is it possible to provide these outputs? Depending on what is seen within this information it will provide us a direction moving forward based on where the memory is being used.
-Nick
- Mark as New
- Bookmark
- Subscribe
- Mute
- Subscribe to RSS Feed
- Permalink
- Report Inappropriate Content
07-12-2010 07:46 AM
Nick
How do i collect output of these commands?
This switch is GUI based.
- Mark as New
- Bookmark
- Subscribe
- Mute
- Subscribe to RSS Feed
- Permalink
- Report Inappropriate Content
07-12-2010 12:00 PM
Rajesh,
You can access these commands by accessing the CE500 via http://
-Nick
- Mark as New
- Bookmark
- Subscribe
- Mute
- Subscribe to RSS Feed
- Permalink
- Report Inappropriate Content
07-12-2010 12:16 PM
- Mark as New
- Bookmark
- Subscribe
- Mute
- Subscribe to RSS Feed
- Permalink
- Report Inappropriate Content
07-12-2010 12:42 PM
Rajesh,
Based on these outputs there is no problem. The CE-500 is operating within normal bounds. However, this output does not reflect what the monitoring software is providing you. For example, in these outputs we can see that the router is only using about 70% of its memory in the processor pool:
Command was: show mem sum--------------------------------------------------------------------------------
Head Total(b) Used(b) Free(b) Lowest(b) Largest(b)
Processor 11A1900 11921152 8319888 3601264 2439432 3290864
I/O 1D00000 3137536 1620904 1516632 1084512 1149000
Using 8.3 MB of 11.9 MB Total. It also shows us that there has always been at least 2.4 MB free (Lowest). This is not a problem as far as the switch and its opperating capabilities. What is the monitoring software that you are using? And what MIBs is it polling to retrieve this information?
-Nick
- Mark as New
- Bookmark
- Subscribe
- Mute
- Subscribe to RSS Feed
- Permalink
- Report Inappropriate Content
07-12-2010 12:48 PM
Hi Nick
This is non peak hour, almost midnight.
No end users present at this moment. Not much Voice/Data traffic.That could be the reason.
Previously I have attached monitoring toll output, shows more than 92% memory utilization.
- Mark as New
- Bookmark
- Subscribe
- Mute
- Subscribe to RSS Feed
- Permalink
- Report Inappropriate Content
07-12-2010 12:59 PM
Monitoring software is SNMP based solarwind
70% memory during no users voice/.data activity, is it normal? during working hours it goes beyond 92%
- Mark as New
- Bookmark
- Subscribe
- Mute
- Subscribe to RSS Feed
- Permalink
- Report Inappropriate Content
07-12-2010 01:01 PM
Possibly, however that wouldn't apply to this device. At the lowest it has had 2.4 MB free (Lowest), this would reflect a percentage of around 80%. 92% utilized would be more like 1 MB free. On this CE-500 that has never happened. The outputs that we see right now show things within the normal range (both currently and at its peak). Is there a way for you to determine which MIB Solarwinds is displaying on that particular graphic?
-Nick
- Mark as New
- Bookmark
- Subscribe
- Mute
- Subscribe to RSS Feed
- Permalink
- Report Inappropriate Content
07-12-2010 01:25 PM
- Mark as New
- Bookmark
- Subscribe
- Mute
- Subscribe to RSS Feed
- Permalink
- Report Inappropriate Content
07-12-2010 01:26 PM
Unless you have real problems (switch not working correctly), you should not concern about memory utilization.
- Mark as New
- Bookmark
- Subscribe
- Mute
- Subscribe to RSS Feed
- Permalink
- Report Inappropriate Content
07-13-2010 01:37 AM
Hi
Show version
cisco WS-CE500-24PC (PowerPC405) processor (revision E0) with 29696K/3064K bytes of memory.
This switch has 29696K of memory
but 'show memory summ' shows less memory
Command was: show proc mem sorted--------------------------------------------------------------------------------
Total: 10215764, Used: 7793104, Free: 2422660
and
Command was: show mem sum--------------------------------------------------------------------------------
Head Total(b) Used(b) Free(b) Lowest(b) Largest(b)
Processor 1341EAC 10215764 7790384 2425380 1588268 1817504
I/O 1D00000 3137536 1696928 1440608 918056 1115584
- Mark as New
- Bookmark
- Subscribe
- Mute
- Subscribe to RSS Feed
- Permalink
- Report Inappropriate Content
07-13-2010 05:57 AM
Rajesh,
The 'show version' displays the total amount of installed memory. On the CE-500 this is 32 MB, and is not upgradable. The 'show mem sum' and 'show proc mem sorted' display the amount of memory available after bootup. This will be significantly less than the total 32 MB that is installed because on boot up the following happens:
1) The installed memory is divided into two pools (Processor and I/O)
2) The IOS image is decompressed into memory
Once these two things have taken place, the TOTAL is what remains within the processor pool. So the 32 MB that is installed breaks down as follows:
10215764 bytes (Processor Pool Memory) + 3137536 bytes (I/O Pool Memory) + 20,201,132 bytes (IOS Image) = 33,554,432 bytes (or 32 MB)
The amount of memory required for the IOS image will vary slightly depending on the image and the features it contains. As a general rule of thumb an IOS image will decompress to about 2-3X its size when it is compressed.
-Nick
Discover and save your favorite ideas. Come back to expert answers, step-by-step guides, recent topics, and more.
New here? Get started with these tips. How to use Community New member guide