- Cisco Community
- Technology and Support
- Security
- Security Blogs
- Using CESA to Solve Endpoint Blindness for a World Class InfoSec Team
- Subscribe to RSS Feed
- Mark as New
- Mark as Read
- Bookmark
- Subscribe
- Printer Friendly Page
- Report Inappropriate Content
Cisco has an amazing set of products like AMP for Endpoints and Cisco Umbrella protecting devices from advanced malware threats. There were other user and endpoint scenarios that remained unsolved until we introduced the new Cisco Endpoint Security Analytics (CESA) solution that was recently announced. CESA provides an unprecedented level of endpoint and user networking visibility built on Cisco AnyConnect Network Visibility Module (NVM) endpoint telemetry and Splunk Enterprise. Underlying the NVM technology is a protocol called nvzFlow (en-vizzy-flow) that I have blogged about in the past.
In This Article:
Why We Built CESA
Working with Great Partners like Splunk and Samsung
The Technology Behind CESA
Why Did We Build CESA?
The CESA solution was originally developed by the Office of the Security CTO and then integrated into Cisco AnyConnect and Splunk products to solve a set of issues for Cisco InfoSec. Cisco InfoSec realized that getting all the endpoint visibility they needed to perform incident response was a challenge. There were also endpoint security blind spots as more Cisco employees were working off premise and connecting to both enterprise and cloud resources. They needed a way to collect and store a year of data for analysis of incidents while also getting information in real‑time to see what is happening in the network. You can read more about the Cisco InfoSec use case in their case study on CESA.
The Office of the Security CTO looks at current and future customer problems that are not being solved by existing technology and then come up with ideas on how to solve them. My fellow coinventors, Andrew Zawadowskiy and Donovan O’Hara from the CTO Advanced Development team built the initial Proof of Concept and then worked on the final product release with the AnyConnect development team.
As we thought about ways to solve the problems Cisco InfoSec was facing, we wanted to do it in a way that built on standards technology so that not only could Cisco Stealtwatch and Cisco Tetration support it, but also provide an ecosystem for key partners to participate. This is why we chose to build on IPFIX. It is the perfect protocol to build the enhanced context found in nvzFlow. What do we mean by "Enhanced Context"?
The 5 key endpoint visibility categories conveyed by the protocol or "Enhanced Context" are:
- User
- Device
- Application
- Location
- Destination
At the end of the blog will be a helpful table to show you details of the enhanced context that is provided.
Working with Great Partners like Splunk and Samsung
One of the key features of CESA is Splunk Enterprise, which performs the analytics and alerting on the NVM telemetry, turning it into actionable events. The new CESA Built on Splunk product, available exclusively from Cisco, provides a Splunk package customized and priced specifically for analyzing NVM telemetry. Cisco InfoSec has been using the CESA solution for over two years now. As noted earlier, you can read more about it in their Case Study.
Spunk Enterprise is a fantastic tool. It was really easy for us to take the Cisco AnyConnect NVM data and not only import it into Splunk, but to also quickly create a high value set of dashboards and reports from the data. There are two components in the Splunk store that make up the solution: Cisco AnyConnect Network Visibility Module (NVM) App for Splunk and Cisco NVM Technology Add-on for Splunk. Because NVM produces so much high value data, Splunk created a special per-endpoint license available exclusively from Cisco that makes budgeting predictable and saves you money. We also put together a helpful deployment guide to get you going.
Below is an example of the dozens of reports available in the AnyConnect NVM Splunk Dashboard.
As you can see the solution provides visibility into what applications are connecting to what domains and how much data is being transmitted/received.
You can easily integrate your favorite investigation tools right into the Splunk Enterprise dashboards. For example, you can pivot from a DNS domain name observable into Cisco Umbrella, Talos Intelligence or Cisco Threat Response with just a couple lines of HTML. This will allow you to obtain a threat disposition on the domain.
Similarly, you can take the SHA256 hash observable and pivot right into AMP for Endpoints, ThreatGrid or Cisco Threat Response. This will allow you to obtain a threat disposition on the binary.
We’ve provided those integrations for you in the default dashboards. You can easily add more just by editing them to include your favorite tools. Let us know if there is anything else that would be useful in the default screens.
Samsung has been another excellent partner from the start. We have worked with them closely on their Knox program for a number of years with AnyConnect integrations and neat features like per-app VPN. When we explained to them what we wanted to do with Cisco AnyConnect NVM, they were excited to help and developed the Network Platform Analytics (NPA) framework to make it possible. It is the only framework available on mobile platforms to support Cisco AnyConnect NVM. The best part is that you can enable and provision this capability using your favorite Enterprise Mobility Management (EMM) solution – no special device-mode needed! Keep an eye out for a forthcoming quick‑start guide on this technology. NVM is also available on Windows, MacOS and Linux platforms.
Those are some of the high points of the CESA Built on Splunk solution. If you’d like to get into further technical details on the solution architecture and NVM telemetry itself, see below.
Deep Dive into the Technology Behind CESA
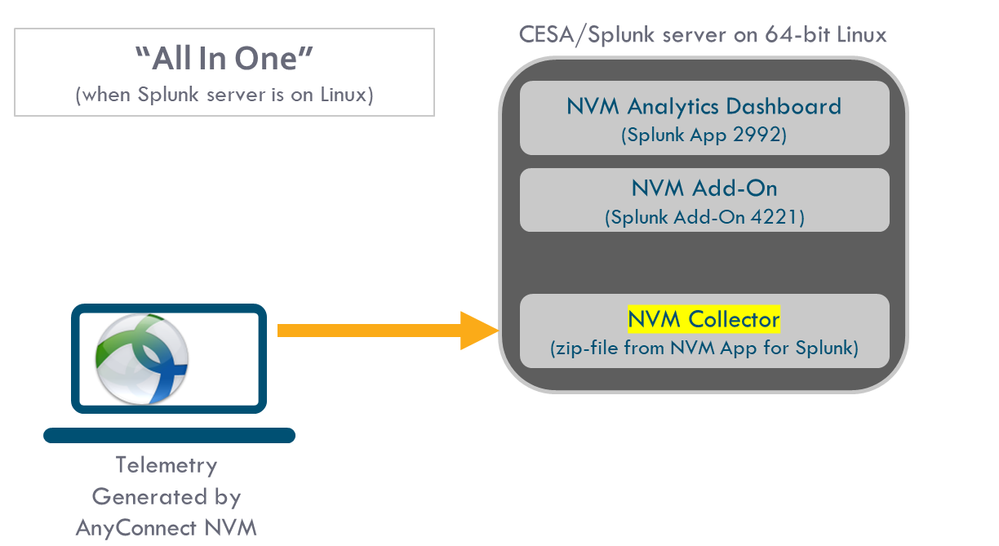
Here is a high-level overview of the components that make up the CESA solution:
Now let’s take a deeper dive at the awesome visibility data you get from AnyConnect NVM and the nvzFlow protocol. Below is a table that describes all of the rich visibility data that accompanies the IPFIX network flow information.
There are 3 templates as part of the nvzFlow Protocol:
- Endpoint – Fields that are associated with an Endpoint Device, such as OS Name.
- Interface – Fields associated with the network interface, such as Adapter Name.
- Flow – Fields associated with the flow itself, such as L4 Bytes Out.
Note that some fields will be present in multiple templates for cross correlation purposes.
These are mandatory fields, while all others can be either anonymized [one-way hash] or not sent at all.
|
Name |
Description
*all string values are encoded in UTF-8 format |
Template Member (M) = Mandatory |
|
nvzFlowUDID |
20 byte Unique Device ID that identifies the endpoint. |
E, I, F
|
|
nvzFlowLoggedInUser |
This is the logged in user on the physical device in the form Authority\Principle. E.g., ACME\JSmith or <machine>\JSmith
|
I |
|
nvzFlowOSName |
Name of the operating system.
|
E |
|
nvzFlowOSVersion |
Version of the operating system.
|
E |
|
nvzFlowSystemManufacturer |
Name of the manufacturer.
|
E |
|
nvzFlowSystemType |
Type of the system. E.g., x86 or x64 |
E |
|
nvzFlowProcessAccount |
Authority\Principle of the process associated with the flow.
|
F |
|
nvzFlowParentProcessAccount |
Authority\Principle of the parent of the process associated with the flow. E.g., ACME\JSmith or <machine>\JSmith |
F |
|
nvzFlowProcessName |
Name of the process associated with the flow. E.g., firefox.exe |
F |
|
nvzFlowProcessHash |
SHA256 hash of the process image on disk associated with the flow. |
F |
|
nvzFlowParentProcessName |
Name of the parent of process associated with the flow. |
F |
|
nvzFlowParentProcessHash |
SHA256 hash of the process image on disk of the parent process associated with the flow. |
F |
|
nvzFlowDNSSuffix |
Per-interface DNS suffix configured on the adapter associated with the flow for the endpoint. E.g., cisco.com |
F
|
|
nvzFlowDestinationHostname |
The FQDN (hostname) that resolved to the destination IP on the endpoint. E.g., mail.google.com
|
F |
|
nvzFlowL4ByteCountIn |
Total number of incoming bytes on the flow at Layer4 (Transport). [payload only, without L4 headers] |
F |
|
nvzFlowL4ByteCountOut |
Total number of outgoing bytes on the flow at Layer4 (Transport). [payload only, without L4 headers] |
F |
|
nvzFlowOSEdition |
The OS Edition, such as Windows 10 Enterprise
|
E |
|
nvzFlowModuleNameList |
List of 0 or more names of the modules hosted by the process that generated the flow. This can include the main DLLs in common containers such as dllhost, svchost, rundll32, etc. It can also contain other hosted components such as the name of the jar file in a JVM. |
F |
|
nvzFlowModuleHashList |
List of 0 or more SHA256 hashes of the modules associated with the nvzFlowModuleNameList |
F |
|
nvzFlowCoordinatesList |
List of 32bit floating point values representing Accuracy, Latitude, Longitude, [Altitude] respectively. Altitude is optional. Coordinate based location information such as GPS, Wi-Fi Approximation, etc., Accuracy in meters – defines the error margin. |
F |
|
nvzFlowInterfaceInfoUID
|
Unique ID for an interface meta-data. Should be used to lookup the interface meta-data from the InterfaceInfo records.
|
F, I (M) |
|
nvzFlowInterfaceIndex |
The index of the Network interface as reported by the OS.
|
I |
|
nvzFlowInterfaceType |
Interface Type, such as Wired, Wireless, Cellular, VPN, Tunneled, Bluetooth, etc. Enumeration of network types as defined below.
|
I |
|
nvzFlowInterfaceName |
Network Interface/Adapter name as reported by the OS. |
I |
|
nvzFlowInterfaceDetailsList |
List of name value pair |
I |
|
nvzFlowInterfaceMacAddress |
Mac address of the interface.
|
I |
|
nvzFlowLoggedInUserAccountType |
Account type of the logged-in user. As per the enumeration of AccountType as defined below.
|
F |
|
nvzFlowProcessAccountType |
Account type of the process account. As per the enumeration of AccountType as defined below.
|
F |
|
nvzFlowParentProcessAccountType |
Account type of the parent-process account. As per the enumeration of AccountType as defined below.
|
F |
|
virtualStationName |
Standard IPFIX Element 350 is populated with the configured device/computer name. For example, Jane-Doe-WinPC.
|
E |
Enumeration Types
AccountType
All Platforms
Unknown – 0x0000
Domain User – 0x8000 (Mask. 16th bit set for Domain user. Eg., a Domain-user administrator will have 0x8002 as the type).
Windows
Standard User – 0x0001, Admin User – 0x0002, Guest User – 0x0003
Not Elevated – 0x4000 (BitMask. 15th bit is set for users who are admins, but not UAC’ed yet. Eg., an admin user that hasn’t elevated shall have an AccountType of 0x4002)
Elevated – 0x2000 (BitMask. 14th bit is set for users who are admins and are currently running in elevated mode)
Mac/Linux
Standard User – 0x0001, Root user – 0x0004
Not Elevated – 0x4000 (BitMask. 15th bit is set for sudo’ers who aren’t root yet. Standard users who have sudo privilege but not yet elevated into root, shall have an AccountType of 0x4001)
Elevated – 0x2000 (BitMask. 14th bit is set for sudo’ers users who are currently running in elevated mode as root)
Bit Mapping for AccountTypes
|
16 |
15 |
14 |
13 |
12 |
11 |
10 |
9 |
8 |
7 |
6 |
5 |
4 |
3 |
2 |
1 |
|
Domain User Bit |
Not Elevated Bit |
Elevated Bit |
Reserved for future bit-masks |
Specific AccountType values |
|||||||||||
InterfaceType
1 – Wired Ethernet, 2 – Wireless (802.11), 3 – Bluetooth, 4 – Token Ring, 5 – ATM (Slip),
6 – PPP, 7 – Tunnel (generic), 8 – VPN, 9 – Loopback, 10 – NFC, 11 – Cellular,
15 – Unknown/Unspecified
Here is what would be included in an IPv6 nvzflow record
IPv6 Per-Flow Data Template (v3 ID: 268, v2-only ID: 264)
protocolIdentifier (IPFIX standard information element : 4) (MANDATORY)
sourceIPv6Address (IPFIX standard information element : 27) (MANDATORY)
sourceTransportPort (IPFIX standard information element : 7) (MANDATORY)
destinationIPv6Address (IPFIX standard information element : 28) (MANDATORY)
destinationTransportPort (IPFIX standard information element : 11) (MANDATORY)
flowStartSeconds (IPFIX standard information element : 150) (MANDATORY)
flowEndSeconds (IPFIX standard information element : 151) (MANDATORY)
nvzFlowUDID (MANDATORY)
nvzFlowLoggedInUser
nvzFlowLoggedInUserAccountType (v3)
nvzFlowProcessAccount
nvzFlowProcessAccountType (v3)
nvzFlowProcessName
nvzFlowProcessHash
nvzFlowParentProcessAccount
nvzFlowParentProcessAccountType (v3)
nvzFlowParentProcessName
nvzFlowParentProcessHash
nvzFlowL4ByteCountIn
nvzFlowL4ByteCountOut
nvzFlowDNSSuffix
nvzFlowDestinationHostname
nvzFlowInterfaceInfoUID (MANDATORY – v2)
nvzFlowModuleNameList (v2)
nvzFlowModuleHashList (v2)
nvzFlowCoordinatesList (v2)
Data Model and Correlation IDs
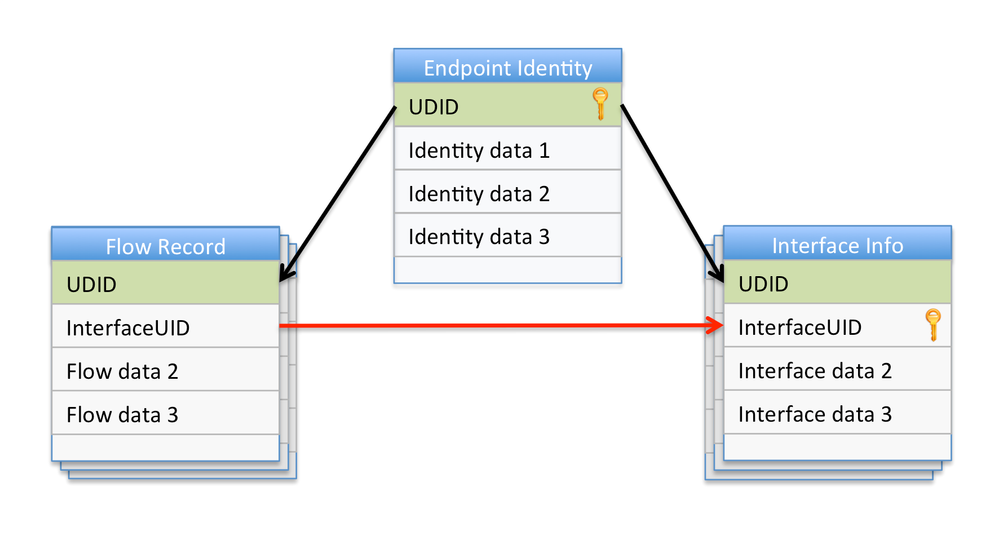
The following graphic shows the data model of the nvzFlow protocol and how the different correlation IDs are used to associate the different data collections.
A collector will likely store 3 sets of data records, one for each collection of data. Analytics and reporting will correlate the 3 sets of data using the UDID as the key across the data sets. Additionally, for interface information, a correlation from the flow record to the interface information record will be done using the Interface UID.
If you have any questions about the underlying technology post them below in the comments. Let us know what you think of the new CESA solution too!
You must be a registered user to add a comment. If you've already registered, sign in. Otherwise, register and sign in.
Find answers to your questions by entering keywords or phrases in the Search bar above. New here? Use these resources to familiarize yourself with the community:


