- Cisco Community
- Technology and Support
- Networking
- Switching
- Re: Device experiencing high memory utilization 9300 switch
- Subscribe to RSS Feed
- Mark Topic as New
- Mark Topic as Read
- Float this Topic for Current User
- Bookmark
- Subscribe
- Mute
- Printer Friendly Page
Device experiencing high memory utilization 9300 switch

")
- Mark as New
- Bookmark
- Subscribe
- Mute
- Subscribe to RSS Feed
- Permalink
- Report Inappropriate Content
10-12-2022 11:14 AM
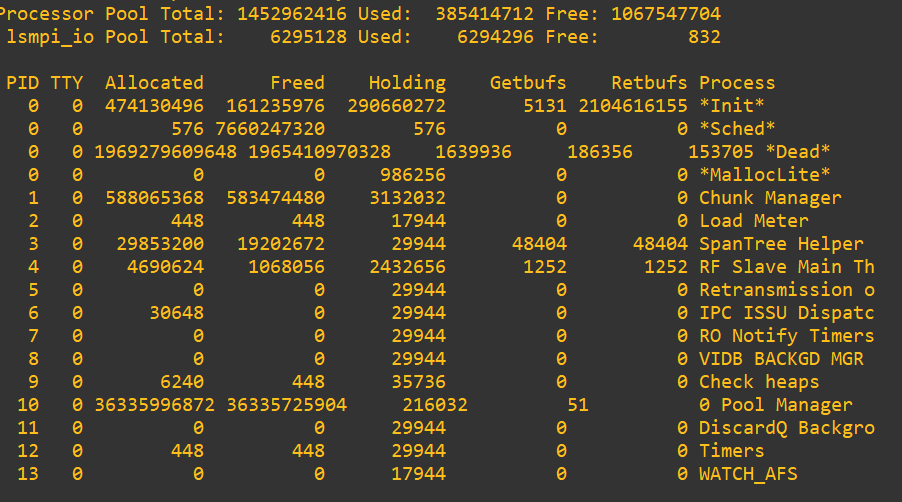
We are receiving notification on DNA that one of our switches utilizes high memory. Anyone can suggest to me what could be the reason.
Watch Model: 9300-48 with stack and only 832 only free please see the screenshot. Thanks
- Labels:
-
LAN Switching
- Mark as New
- Bookmark
- Subscribe
- Mute
- Subscribe to RSS Feed
- Permalink
- Report Inappropriate Content
10-25-2024 01:24 AM
i have the same scenario with a stack of 2x9300-24P running on 17.6.3 where switch 1 the active one has high memory utilization:
#sh processes memory platform sorted location switch 1 r0
System memory: 7750576K total, 7053748K used, 696828K free,
Lowest: 679132K
Pid Text Data Stack Dynamic RSS Name
----------------------------------------------------------------------
2507 87 3734740 136 3619496 3734740 pubd
Yes there is a DNAC appliance
- Mark as New
- Bookmark
- Subscribe
- Mute
- Subscribe to RSS Feed
- Permalink
- Report Inappropriate Content
10-25-2024 01:48 AM - edited 10-25-2024 03:39 AM
The choices are:
1. Reboot the switch
2. Disable DNAC telemetry:
conf t
 no nmsp enable
end
Please note, "upgrade the firmware" is not a solution but an excuse. Every IOS-XE memory leaks like a hydrant. If the DNAC does not memory leak in one specific version, another process might.
- Mark as New
- Bookmark
- Subscribe
- Mute
- Subscribe to RSS Feed
- Permalink
- Report Inappropriate Content
10-25-2024 02:07 AM
Hi Leo , can i ask why to disable DNAC? the device is provisioned via DNAC
- Mark as New
- Bookmark
- Subscribe
- Mute
- Subscribe to RSS Feed
- Permalink
- Report Inappropriate Content
10-25-2024 02:31 AM
@Andrew9003 wrote:
why to disable DNAC
I meant disable the "telemetry" between the switch and DNAC.
Why? Because DNAC &/or DNA Spaces are very well known to cause memory leaks.
- Mark as New
- Bookmark
- Subscribe
- Mute
- Subscribe to RSS Feed
- Permalink
- Report Inappropriate Content
10-25-2024 03:11 AM
Thank you for the explanation, will try out in a maintenance window because it involves reboot.
")
")
- Mark as New
- Bookmark
- Subscribe
- Mute
- Subscribe to RSS Feed
- Permalink
- Report Inappropriate Content
10-25-2024 03:24 AM - edited 10-25-2024 03:34 AM
Please check BUG ID " CSCwe09745" This may help.
Symptom: A catalyst switch, which is managed by DNAC, may exhibit a memory leak within the Pubd process if the switch is not able to connect with Telemetry to DNAC.
The switch needs to be managed by DNAC and have the tls-native protocol configured along with some telemetry subscriptions. The leak will occur when the switch attempts to connect to DNAC but is unsuccessful. The state will be "connecting", as verified via the below commands:
IOS-XE 17.6 and Earlier:
CAT9300#show telemetry internal connection
Telemetry connections
Index Peer Address Port VRF Source Address State
----- -------------------------- ----- --- -------------------------- ----------
9825 X.X.X.X. 25103 0 Y.Y.Y.Y Connecting
IOS-XE 17.7 and Later:
CAT9300#show telemetry connection all
Telemetry connections
Index Peer Address Port VRF Source Address State State Description
----- -------------------------- ----- --- -------------------------- ---------- --------------------
9825 X.X.X.X 25103 0 Y.Y.Y.Y Connecting Connection request made to transport handler
Workaround: 1. Disable telemetry on the switch, and troubleshoot why telemetry is not able to successfully connect to DNAC.
OR
2. From DNAC side, execute the following: * Go to the Cisco DNA Center GUI > Provision > Inventory . * Select the affected device and go to Actions > Telemetry > Update Telemetry Settings. * Select the option for Force Configuration Push .
Regards
Shambhu Kumar
- Mark as New
- Bookmark
- Subscribe
- Mute
- Subscribe to RSS Feed
- Permalink
- Report Inappropriate Content
10-25-2024 03:53 AM
Hey Kumar, yes exact same scenario when checking via cli with the command #show telemetry internal connection.
Will try workaround nr 2 and see what happens. Thx
- Mark as New
- Bookmark
- Subscribe
- Mute
- Subscribe to RSS Feed
- Permalink
- Report Inappropriate Content
10-25-2024 04:00 AM
After doing the steps in DNAC , before it was showing Connecting now is Active:
#show telemetry internal connection
Telemetry connections
Index Peer Address Port VRF Source Address State
----- -------------------------- ----- --- -------------------------- ----------
22684 10.107.x.y 25103 0 10.119.x.y Active
- Mark as New
- Bookmark
- Subscribe
- Mute
- Subscribe to RSS Feed
- Permalink
- Report Inappropriate Content
10-25-2024 04:05 AM
I hope it will bring normal memory leak within the Pubd process.
Regards
Shambhu Kumar
- Mark as New
- Bookmark
- Subscribe
- Mute
- Subscribe to RSS Feed
- Permalink
- Report Inappropriate Content
10-25-2024 04:16 AM
I hope so too. Nothing much yet change on:
#sh processes memory platform sorted location switch 1 r0
System memory: 7750576K total, 7061900K used, 688676K free,
Lowest: 662872K
Pid Text Data Stack Dynamic RSS Name
----------------------------------------------------------------------
2507 87 3743568 136 3625548 3743568 pubd
5972 256726 840496 136 484 840496 linux_iosd-imag
16343 203 379124 136 77720 379124 fed main event
I guess would require a reboot.
- Mark as New
- Bookmark
- Subscribe
- Mute
- Subscribe to RSS Feed
- Permalink
- Report Inappropriate Content
10-25-2024 12:21 PM
@Andrew9003 wrote:
System memory: 7750576K total, 7061900K used, 688676K free,
Lowest: 662872K
Pid Text Data Stack Dynamic RSS Name
----------------------------------------------------------------------
2507 87 3743568 136 3625548 3743568 pubd
5972 256726 840496 136 484 840496 linux_iosd-imag
16343 203 379124 136 77720 379124 fed main event
1. NOTHING should be "above" linux_iosd-imag process. Anything above linux_iosd-imag process is bad.
2. Regularly check the control-plane memory & CPU utilization. When I say "regularly", I really mean DAILY. Use the following commands:
sh platform resources
sh platform software status control-processor brief
NOTE: Memory utilization of <40% is normal. Memory utilization is >50% is an irrefutable sign of a memory leak.
3. If the switches are in a stack/VSS, the higher the chances of a memory leak with the "stackmgr" process.
4. Regular reboot/cold-reboot is the best workaround. Make it a point to reboot/cold-reboot the stack every 12 months.
- Mark as New
- Bookmark
- Subscribe
- Mute
- Subscribe to RSS Feed
- Permalink
- Report Inappropriate Content
11-16-2024 05:57 PM - edited 11-16-2024 05:58 PM
@Andrew9003 wrote:2507 87 3743568 136 3625548 3743568 pubd 5972 256726 840496 136 484 840496 linux_iosd-imag
Disabling telemetry will not bring down the "stuck" memory and it will remain at that level until the controller crashes or reboots.
Disabling telemetry, however, will "stop" (or minimize the rate of climb) the memory leak.
- « Previous
-
- 1
- 2
- Next »
Discover and save your favorite ideas. Come back to expert answers, step-by-step guides, recent topics, and more.
New here? Get started with these tips. How to use Community New member guide