- Cisco Community
- Technology and Support
- Networking
- Switching
- Re: Graphic peaks in monitoring software (PRTG) C9200
- Subscribe to RSS Feed
- Mark Topic as New
- Mark Topic as Read
- Float this Topic for Current User
- Bookmark
- Subscribe
- Mute
- Printer Friendly Page
Graphic peaks in monitoring software (PRTG) C9200
- Mark as New
- Bookmark
- Subscribe
- Mute
- Subscribe to RSS Feed
- Permalink
- Report Inappropriate Content
02-11-2020 08:02 AM
Hi everyone! I recently migrated all my old switches to the 9200 platform, but I was affected by this bug...
https://bst.cloudapps.cisco.com/bugsearch/bug/CSCvs27296
Use PRTG, when monitoring any interface with SNMP spikes are generated, I have an open case with no solution for this bug.
Anyone with this problem? any ideas?
Regards
- Labels:
-
Catalyst 9000
- Mark as New
- Bookmark
- Subscribe
- Mute
- Subscribe to RSS Feed
- Permalink
- Report Inappropriate Content
02-11-2020 04:45 PM
- Mark as New
- Bookmark
- Subscribe
- Mute
- Subscribe to RSS Feed
- Permalink
- Report Inappropriate Content
02-12-2020 08:00 AM
thanks for answering Leo, in all 16.12.01
regards.
- Mark as New
- Bookmark
- Subscribe
- Mute
- Subscribe to RSS Feed
- Permalink
- Report Inappropriate Content
02-12-2020 02:31 PM
- Mark as New
- Bookmark
- Subscribe
- Mute
- Subscribe to RSS Feed
- Permalink
- Report Inappropriate Content
02-14-2020 08:01 AM
Hello! I upgraded to 16.12.2, it didn't work, the problem continues...
Regards.
- Mark as New
- Bookmark
- Subscribe
- Mute
- Subscribe to RSS Feed
- Permalink
- Report Inappropriate Content
02-14-2020 02:58 PM
Looking at the "spike", 15% CPU is very, very low. What exactly is the problem?
- Mark as New
- Bookmark
- Subscribe
- Mute
- Subscribe to RSS Feed
- Permalink
- Report Inappropriate Content
02-15-2020 12:30 PM
@Leo Laohoo wrote:
Wait ... Are those CPU or Memory?
Looking at the "spike", 15% CPU is very, very low. What exactly is the problem?
It is not CPU or Memory, they are Mbit/s. PRTG monitoring interfaces where my IP transits are connected.
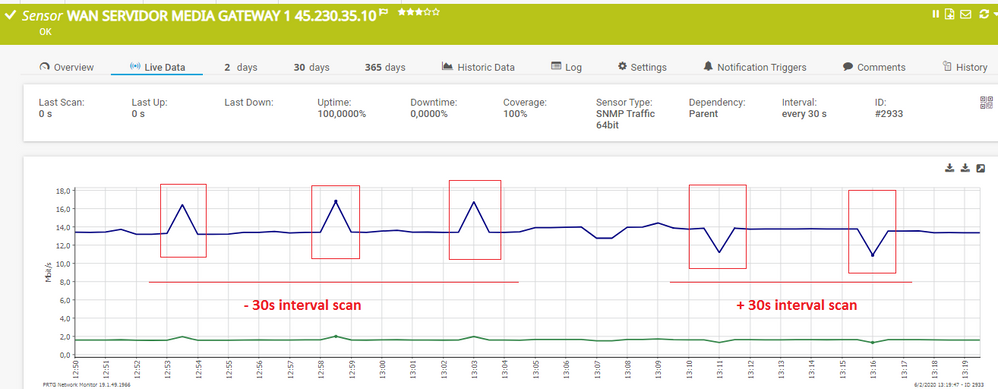
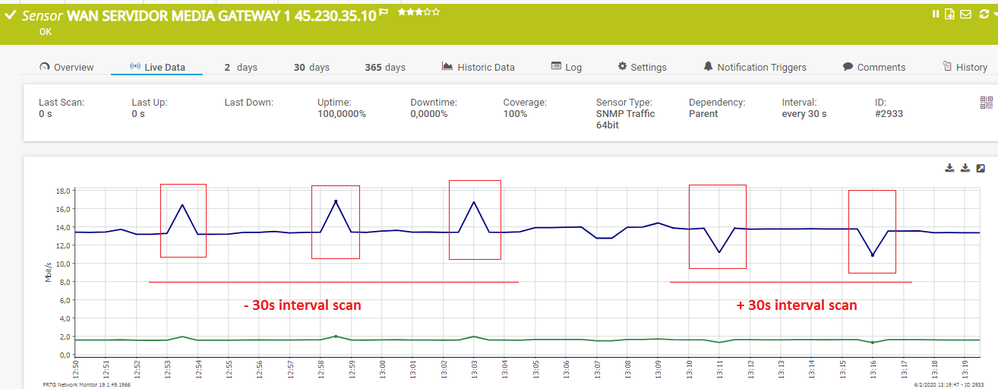
The problem is this, this is a capture of when I monitored an interface with my old TpLink switches
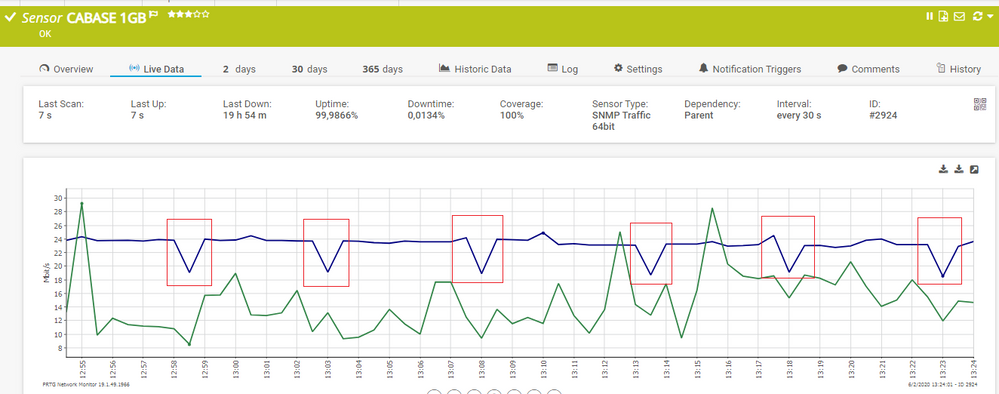
and this is the same interface after migrating to 9200
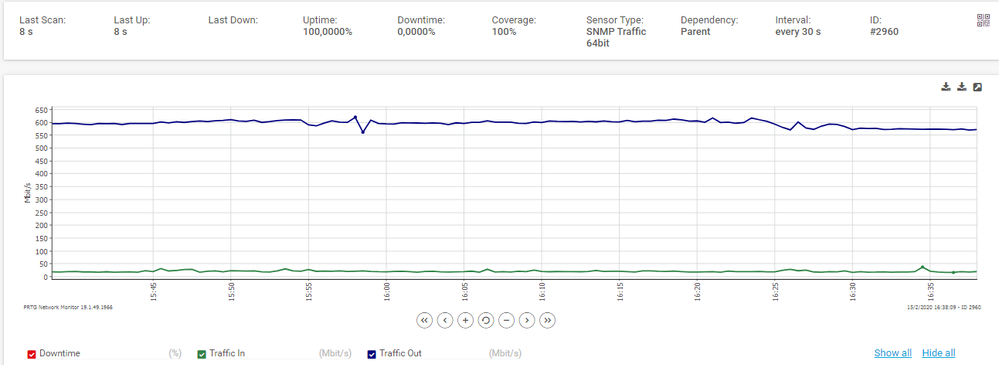
when I do SNMP queries ifHCOutOctets and ifHCInOctets counter's to 9200, it generates symmetric peaks in the graphs, depending on the scan interval the peaks are positive or negative, as you can see..
the TAC closed yesterday my case attributing the problem to this bug
https://bst.cloudapps.cisco.com/bugsearch/bug/CSCvs27296
Saying that I could only wait for the engineers to solve the problem, all my choice is affected since video streaming monitoring and I need the graphics to be taken.
I am very disappointed with the 9200 platform, today when I arrived at my work I was surprised that the counters of a port-channel interface stopped working on another switch
Port-channel3 is up, line protocol is up (connected)
  Hardware is EtherChannel, address is 5c5a.c786.f801 (bia 5c5a.c786.f801)
  Description: TO_ASR_HSI_EDGE_1_HSI_PUBLIC_OUT
  MTU 1500 bytes, BW 2000000 Kbit/sec, DLY 10 usec,
     reliability 255/255, txload 1/255, rxload 1/255
  Encapsulation ARPA, loopback not set
  Keepalive set (10 sec)
  Full-duplex, 1000Mb/s, link type is auto, media type is N/A
  input flow-control is on, output flow-control is unsupported
  Members in this channel: Gi1/0/1 Gi1/0/2
  ARP type: ARPA, ARP Timeout 04:00:00
  Last input never, output 00:00:00, output hang never
  Last clearing of "show interface" counters 04:27:35
  Input queue: 0/2000/0/0 (size/max/drops/flushes); Total output drops: 0
  Queueing strategy: fifo
  Output queue: 0/40 (size/max)
  5 minute input rate 0 bits/sec, 0 packets/sec
  5 minute output rate 0 bits/sec, 0 packets/sec
     0 packets input, 0 bytes, 0 no buffer
     Received 0 broadcasts (0 multicasts)
     0 runts, 0 giants, 0 throttles
     0 input errors, 0 CRC, 0 frame, 0 overrun, 0 ignored
     0 watchdog, 0 multicast, 0 pause input
Sorry for the long post, I'm frustrated.
Regards
- Mark as New
- Bookmark
- Subscribe
- Mute
- Subscribe to RSS Feed
- Permalink
- Report Inappropriate Content
02-15-2020 05:08 PM
If you've tried 16.12.2 and it didn't work, downgrade to the latest 16.6.X.
If this doesn't work, upgrade to the latest 16.9.X.
Give that a whirl.
Discover and save your favorite ideas. Come back to expert answers, step-by-step guides, recent topics, and more.
New here? Get started with these tips. How to use Community New member guide


