")
")
- Subscribe to RSS Feed
- Mark as New
- Mark as Read
- Bookmark
- Subscribe
- Printer Friendly Page
- Report Inappropriate Content
01-24-2017 10:34 PM - edited 03-12-2019 10:25 AM
TranslatorX is a tool to help analyze logs from Cisco Unified Communications Manager (CUCM) and other devices. In this document, I will demonstrate how to display call flow sequence diagrams.
1. Loading trace files
Refer to the Loading trace files into TranslatorX document.
2. Displaying details of each message
Once you have loaded in files, you should see something like below. A summary of the messages in the trace file(s) display in the top half, and the details of the selected message display in the bottom half.
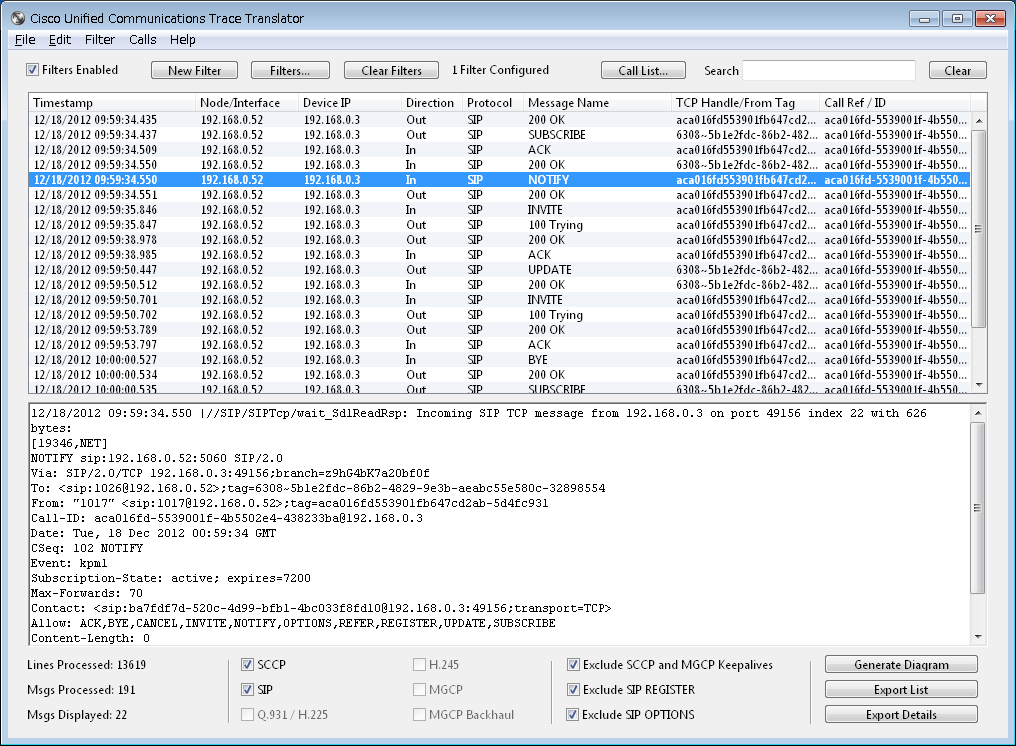
The meaning of each column is as follows.
- Timestamp: The time of the message
- Node/Interface: The CUCM server IP or Voice Gateway / CUBE interface IP where the trace file was taken from
- Device IP: The remote-side device IP address (IP phone, GW, etc.)
- Direction: OUT: Message sent from this CUCM or Voice Gateway, IN: Message sent to this CUCM or Voice Gateway
- Protocol: Protocol type (SCCP, SIP, Q.931, H.225, H.245, MGCP, MGCP Backhaul)
- Message Name: The type of message, appropriate to the given protocol (SIP Invite, H225 Setup, etc.)
- TCP Handle/From Tag: TCP Handle for SCCP, or From tag for SIP
- Call Ref / ID: Q.931 Call Reference or SIP Call-ID
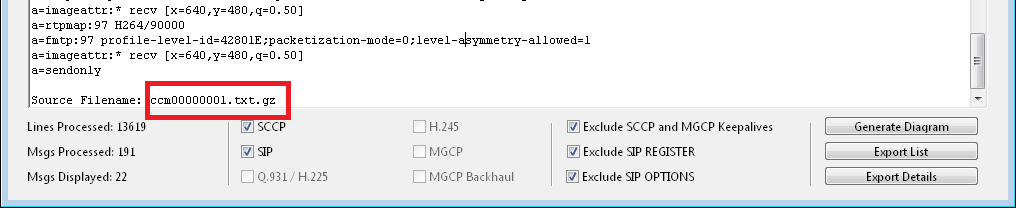
By scrolling to the bottom of the lower half window, you can see the original filename this message was decoded from.
3. Displaying a call flow sequence
Clicking the Generate Diagram button on the bottom right will pop-up with a Call Flow Sequence Diagram like below.

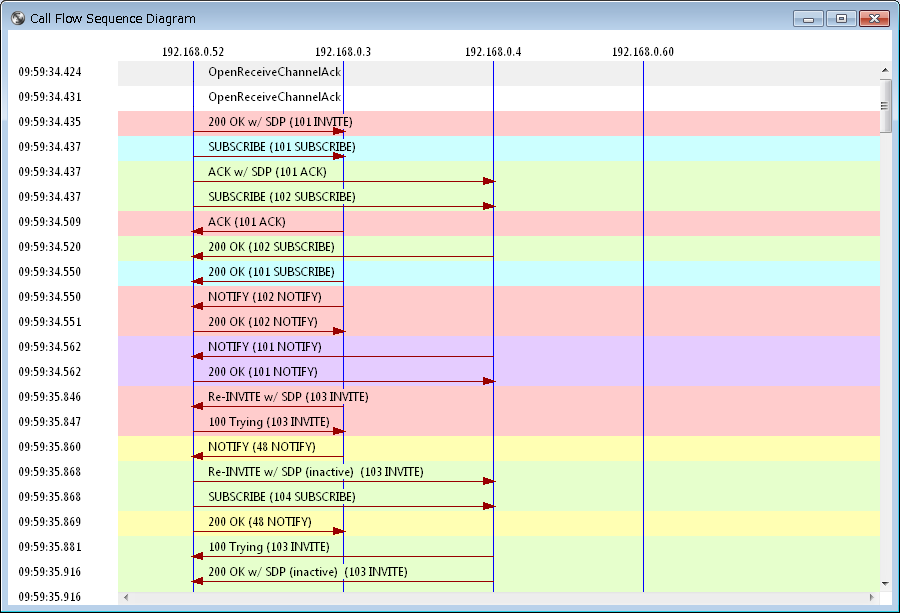
Clicking an individual message will display the corresponding details.
