- Cisco Community
- Technology and Support
- Security
- Security Knowledge Base
- Cognitive Intelligence (formerly Cognitive Threat Analytics or CTA) Release Notes
- Subscribe to RSS Feed
- Mark as New
- Mark as Read
- Bookmark
- Subscribe
- Printer Friendly Page
- Report Inappropriate Content
- Subscribe to RSS Feed
- Mark as New
- Mark as Read
- Bookmark
- Subscribe
- Printer Friendly Page
- Report Inappropriate Content
on
10-26-2017
03:09 AM
- edited on
02-24-2020
07:43 PM
by
Monica Lluis
![]()
Release Notes Moved to Security Blogs
Future release notes will be added to the Security Blogs page with the Cognitive Intelligence label and cognitive-release-notes tag.
February 2019
- Daily Email Report
- After the migration to Amazon Web Services, we unified the domains used for the Cognitive UI and its daily email report. During this month, the report is sent from the
do-not-reply@cta.eu.amp.cisco.comemail address.
- After the migration to Amazon Web Services, we unified the domains used for the Cognitive UI and its daily email report. During this month, the report is sent from the
- Similar Flows on the Incident Details Page
- Flows with similar times and IP addresses are no longer highlighted by the system.
January 2019
- AMP Command-Line Arguments Clustering
- New method for the automated generation of behavior-based candidates for AMP Indicators of Compromise (IOC), based on command-line arguments. The resulting IOC’s use the PK.IOC.CAM suffix. This method is able to identify the execution of malicious binaries even for certain polymorphic malware families with no sandboxing analysis.
- Cognitive UI Update
- We will be introducing a next-generation Cognitive UI. In revamping its design, we identified some features which were not being used regularly by most of our customers. To streamline and improve the user experience, we have removed the Data Exposure Dashboard. The new Cognitive UI will present the same or similar information in a different shape and form.
November and December 2018
- Cognitive Migration to Amazon Web Services
- The Cognitive migration to Amazon Web Services took place in two phases - both phases have been completed.
- Specific details on the migration, required changes, and additional information can be found in the Field Notice.
October 2018
- Renaming Announcement
- Cisco Cognitive Intelligence delivers advanced threat detection capabilities in much of the Cisco Security portfolio. Formerly known as Cognitive Threat Analytics (CTA), Cognitive Intelligence has evolved from a point product to an embedded feature of several Cisco Security products, including Stealthwatch, AMP for Endpoints, and Threat Grid.
- Identify Printer Devices
- Cognitive Intelligence can now identify printer devices and annotate NetFlow and WebFlow incidents with a corresponding label. Based on passive analysis of network behavior, these printer vendors can be recognized: HP, Xerox, Ricoh, Lexmark, Konica-Minolta, Kyocera, and Brother.
- Cognitive Intelligence can now identify printer devices and annotate NetFlow and WebFlow incidents with a corresponding label. Based on passive analysis of network behavior, these printer vendors can be recognized: HP, Xerox, Ricoh, Lexmark, Konica-Minolta, Kyocera, and Brother.
- OS Type and Family
- Some incidents generated from Stealthwatch data flows can now include enhanced information about the OS type and family. This is inferred from the device's behavior when it has been active for a certain time and the OS pattern is sufficiently clear.
- Some incidents generated from Stealthwatch data flows can now include enhanced information about the OS type and family. This is inferred from the device's behavior when it has been active for a certain time and the OS pattern is sufficiently clear.
September 2018
- Cognitive Migration to Amazon Web Services (Phase 2)
- Cognitive Intelligence (formerly Cognitive Threat Analytics or CTA) is migrating to a new location in Amazon Web Services, which results in new IP addresses and an additional URL to access and use the service.
- The migration takes place in two phases:
- Phase 1 has been completed.
- Phase 2 covers the migration of the traffic telemetry ingest services. To maintain access to the service, it may be necessary to update your outbound firewall rules.
- Please change your settings by November 12, 2018. Specific details on the required changes and additional information can be found in the Field Notice.
- Cryptomining Classifier
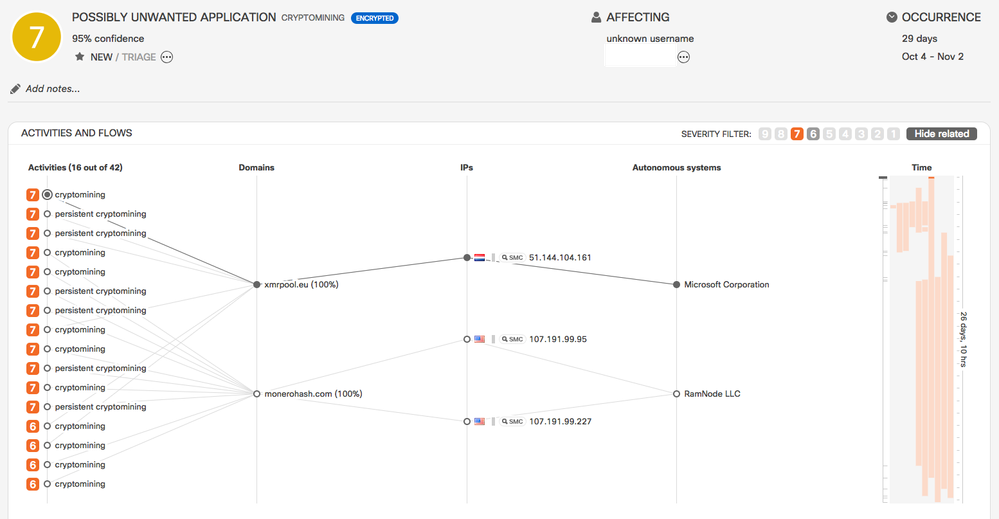
- New cryptomining classifier which uses features from Encrypted Traffic Analytics to detect behavior specific to cryptomining and connections to cryptomining pools.
- The classifier does not rely on external feeds or lists of IP addresses. It provides results with high precision and can distinguish between short-term and long-term mining activities.
- Static Analysis Through Threat Grid
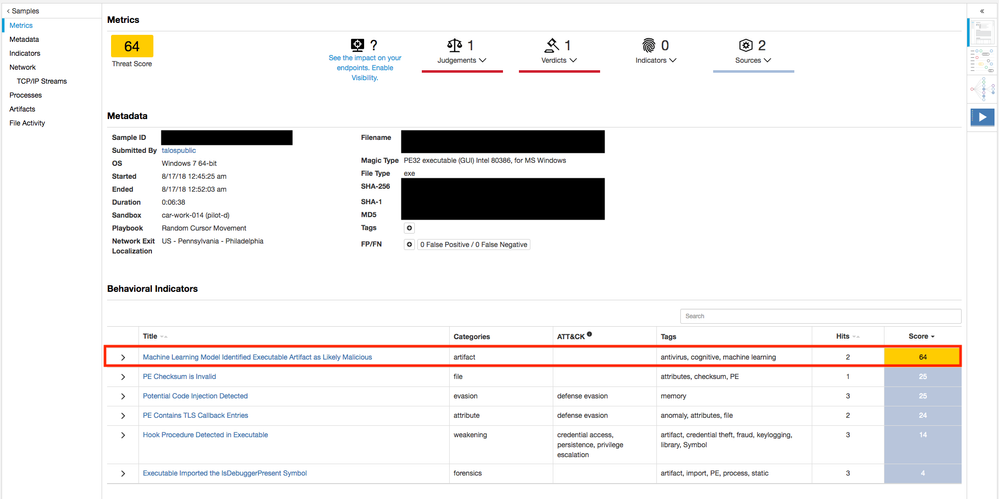
- In cooperation with Threat Grid, Cognitive productized a machine learning model that now runs as one of the behavioral indicators inside of Threat Grid. In doing so, all AMP-enabled devices (ESA/CES, WSA, NGFW w/AMP license) and endpoints (AMP for Endpoints) that submit samples to Threat Grid benefit from improvements in efficacy.
- The machine learning model is trained on a very large number of samples. The output of the training is a decision engine that takes static features of executables as input and returns a verdict on whether it is malicious or unknown.
- In general, a single feature of an artifact will not cause it to be determined as malicious. Instead, the decision engine uses all features about the artifact to determine a verdict.
August 2018
- Cognitive Migration to Amazon Web Services (Phase 1)
- Cognitive Intelligence (formerly Cognitive Threat Analytics or CTA) is migrating to a new location in Amazon Web Services, which results in new IP addresses and an additional URL to access and use the service.
- The migration takes place in two phases. Phase 1 covers the migration of the CTA landing page, CTA portal, API services, and Trusted Automated eXchange of Indicator Information (TAXII) service.
- HTTPS Superforest Classifier
- Enhanced the HTTPS Superforest classifier by including rich features based on the Global Risk Map. This improves the efficacy of the classifier. During testing, it doubled the total number of weighted-by-risk incidents.
- An example of a feature in the Global Risk Map is threat propagation on the domain-user graph. In this graph, domains are connected by an edge if it is observed that they share users that access them.
- URL–Based Convolutional Neural Network Classifier for High-Risk Malware
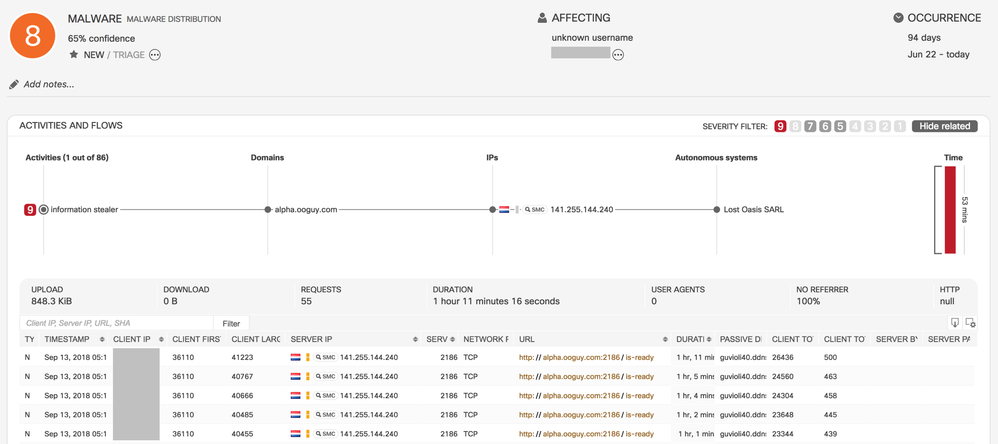
- New Convolutional Neural Network (CNN) classifier which can detect high-risk malware through the analysis of Stealthwatch flows. The input for the classifier are URL strings provided by Encrypted Traffic Analytics or PayloadEx. The classifier transforms each URL string into a feature vector, where the features are not manually-defined but are learned automatically from the training data. This way, the classifier is able to learn more complex patterns and behaviors. In doing so, it extends Cognitive's capability to detect new and previously unseen, high-risk threats, such as banking trojans and information stealers.
- This is an example of an incident triggered by the classifier:
- Internal Network Service Detection
- Can now detect a set of specific servers commonly used across all computer networks.
- The servers are modeled separately in the anomaly detection engine to increase efficacy.
- When an incident is detected on the servers, the server types are shown in the description.
- When north-south traffic is available, Cognitive can detect proxy, NAT, DNS, and SMTP servers.
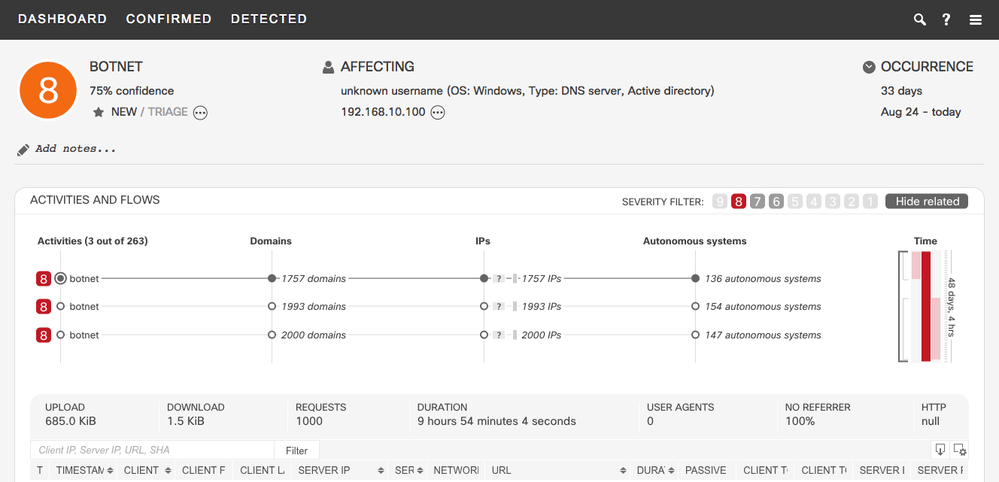
- When east-west traffic is available, Cognitive can detect POP3, IMAP4, mail-submission agent, DHCP, Active Directory DC, SMB, LDAP, Web, FTP, and NTP servers. East-west traffic processing can be manually enabled on-demand by contacting the Stealthwatch Customer Success organization.
- This is an example of an incident on a DNS server:
July 2018
-
Classifier for Redis Database Service Discovery
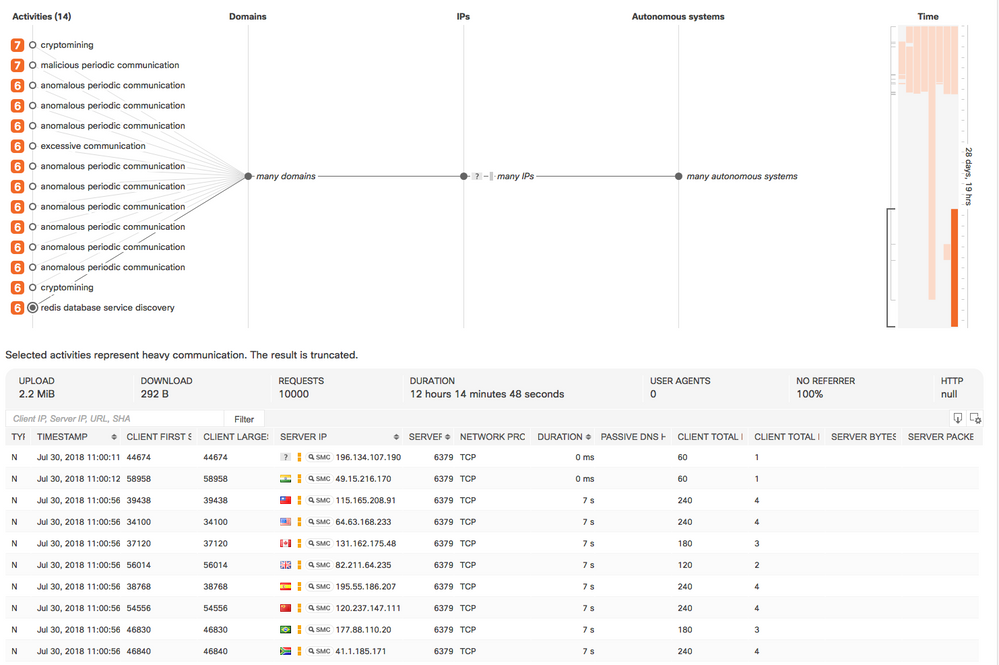
- CTA can now detect the discovery of open Redis database services hosted on the Internet. Associated behavior is commonly associated with malware infections that use unprotected Redis services as a part of the infrastructure.
- Example: This host has made an extremely high number of Redis connection attempts to a large number of IP addresses in different countries. This is a strong indicator of random scanning in an attempt to find an unsecured Redis server. Additionally, this host performs cryptomining and other suspicious communication. These are strong indicators of an ongoing malware infection.
June 2018
-
Autoupdate for Cryptomining Classifier
-
The cryptomining classifier is now updated daily with information from external cryptomining feeds. Each update goes through a verification process to filter out false positives that may occur in external feeds. Autoupdate extends the scope of the classifier and allows it to detect mining activity that uses unusual cryptomining pools as well as stay in tune with new pools that are created.
-
Example: This incident shows communication to an exotic cryptomining pool. The IP address 74.115.50.111 is strongly associated with cryptomining but is not a commonly used cryptomining pool. The IP address is also associated with a C&C channel for malware. This activity was discovered as a result of an autoupdate to the cryptomining classifier.
-
-
URL–Based Neural Network Classifier for High-Risk Malware
- This classifier is the second in a series of neural network classifiers that we plan to deliver. New version of the neural network classifier can now distinguish and specify even more infection types.
- This is an example of an incident triggered by the classifier:
May 2018
-
AMP Probabilistic Threat Propagation
- We utilize CTA analytics algorithms to empower AMP for Endpoint efficacy. Probabilistic threat propagation for AMP (AMP PTP) is a graph algorithm that detects novel variants of known malware. Malware authors often reuse the same command-and-control (C&C) infrastructure. So, the C&C domains remain the same across polymorphic variants. These domains are usually not accessed for benign purposes. Therefore, based on partial knowledge of some instances of a malware family, AMP PTP can detect additional instances of that malware family. The PTP algorithm runs offline and produces retrospective detections. Also, AMP PTP is capable of detecting some file-less infections and process injections. These manifest as known clean Windows OS components accessing domains associated with C&C infrastructure.
-
High-Risk Classifier from Weak-Events Combination
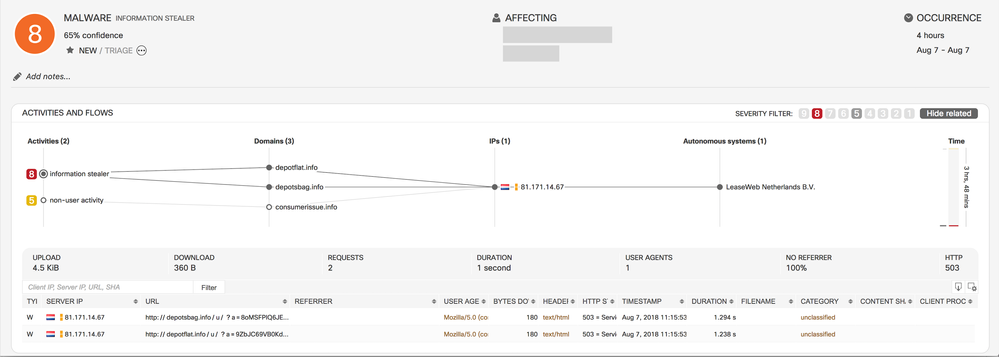
- CTA now introduces an early-stage detection of high-risk infections (such as information stealer, banking trojan, malware distribution) using combinations of low-severity incidents. These combinations can indicate the presence of infection by performing frequent pattern mining on historical data. Cisco manually verifies such infections.
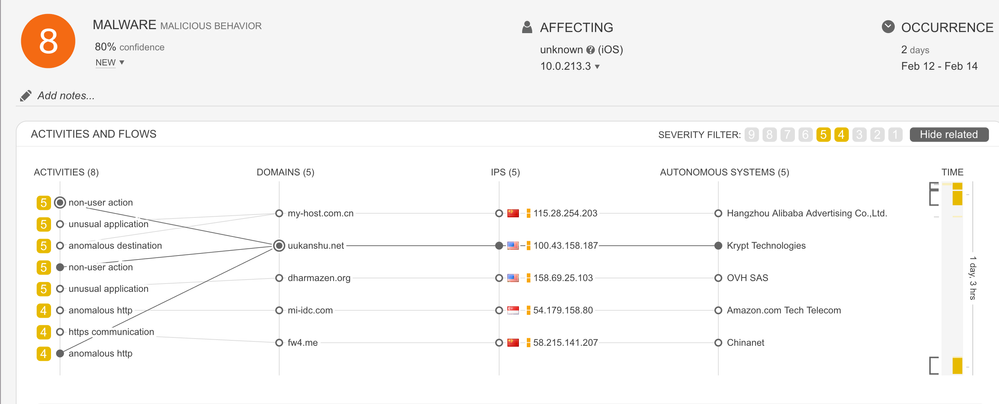
- Example: This incident is an early stage of an Android information stealer. It shows an unusual application with a non-user action connecting to anomalous domains.
April 2018
-
Superforest Enablement for Stealthwatch Customers
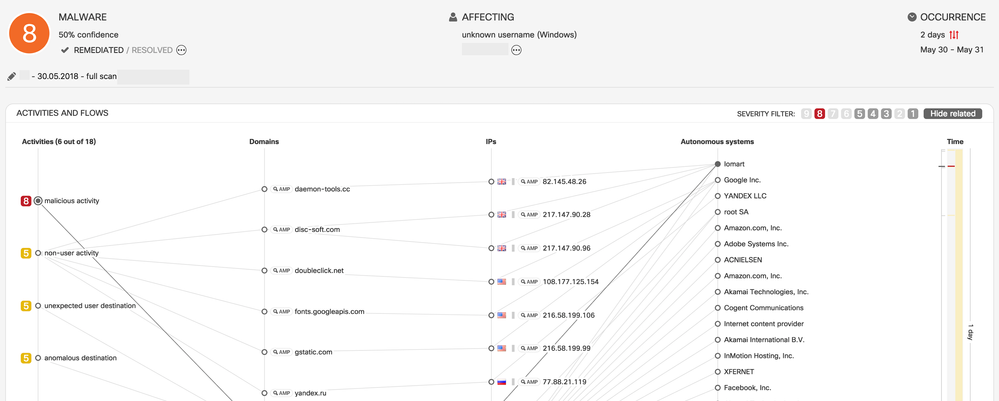
- CTA can now leverage detections from the analysis of WebFlow telemetry to improve the efficacy of analyzing NetFlow telemetry from Stealthwatch. This is accomplished by the system through correlation of both telemetry types. According to measurements by Cisco, the number of both confirmed and detected threats should increase by approximately 10%.
- Example: This is an incident triggered by a malicious domain, which was part of an indicator of compromise (IOC) detected in the WebFlow telemetry.
- Service Modeling
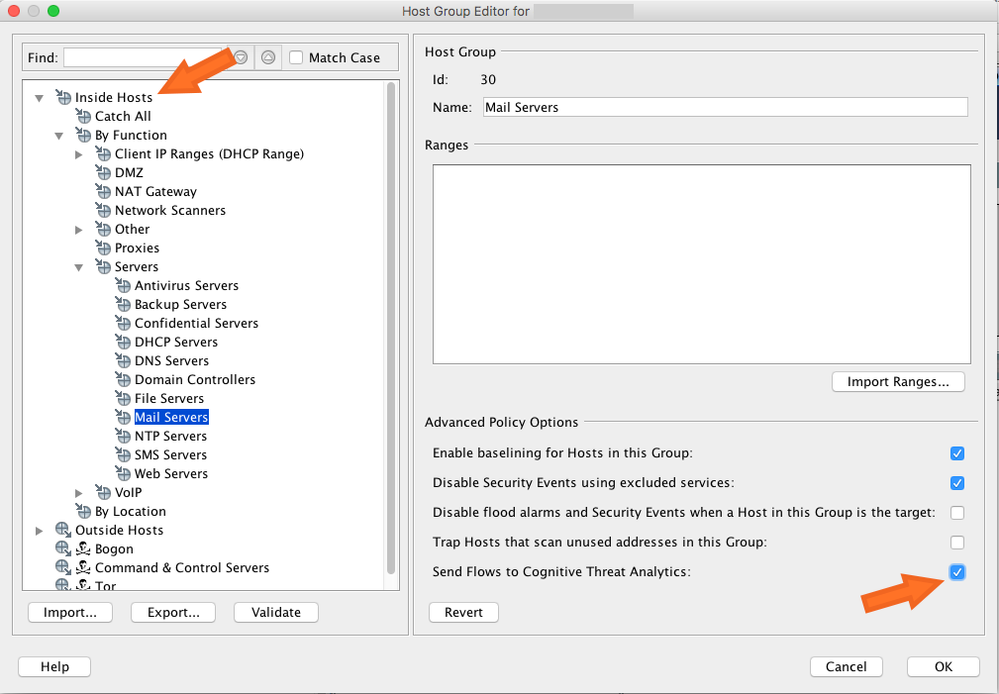
- Service modeling is now available for internal servers (on-demand for Stealthwatch customers). Internal servers are specified using host group definitions. By configuring an internal host group to send Stealthwatch flow records, the user adds data to be sent to the Cognitive cloud for analysis. Service modeling focuses on company internal servers such as mail servers, file servers, web servers, authentication servers, and so on. Analyzing additional traffic from the users to those servers improves the visibility of the exposure of data that may have been misused by malware running on user devices. Do not select all the host groups for sending data. Select only those host groups that represent internal servers.
- Service modeling is now available for internal servers (on-demand for Stealthwatch customers). Internal servers are specified using host group definitions. By configuring an internal host group to send Stealthwatch flow records, the user adds data to be sent to the Cognitive cloud for analysis. Service modeling focuses on company internal servers such as mail servers, file servers, web servers, authentication servers, and so on. Analyzing additional traffic from the users to those servers improves the visibility of the exposure of data that may have been misused by malware running on user devices. Do not select all the host groups for sending data. Select only those host groups that represent internal servers.
- Classifier for Information Stealer through UserAgent
- CTA can now detect malware that misuses the UserAgent field to steal information (such as username, OS type and version, presence of antivirus software) about the internal company devices.
- Example: This is an incident triggered by this classifier. In the highlighted malicious activity called information stealer, malware is attempting to steal sensitive information in the proxyLog field called UserAgent.
- Classifier for Stealthwatch Botnet
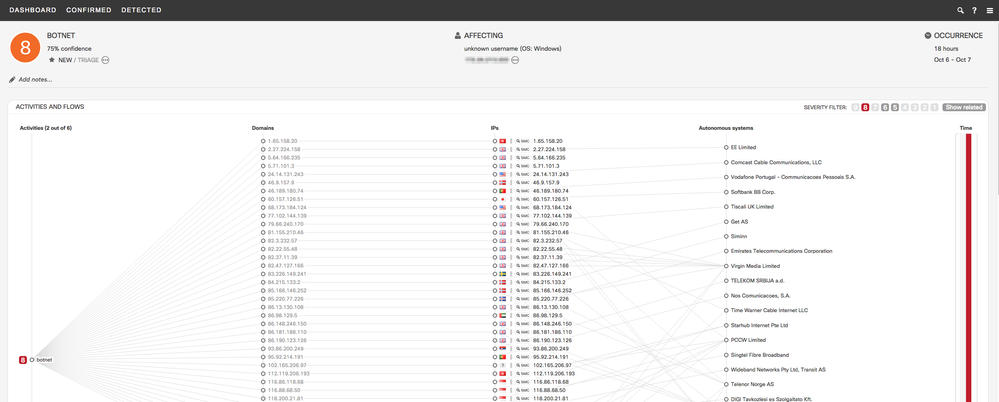
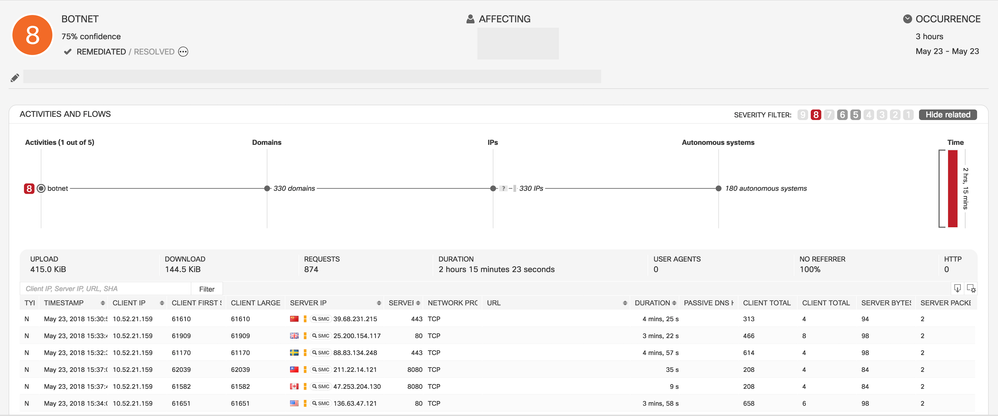
- CTA can now detect botnets on Stealthwatch flows characterized by uniform anomalous/unknown communication to many external nodes. In combination with other features, the SVM classifier is trained specifically to provide high generalization.
- Example: This is an incident triggered by this classifier. Botnets are composed of many remote-controlled computers. This botnet has uniform connections to 330 IP addresses, hosted in 180 autonomous systems. Likely causes include C&C attempts or outbound scanning originating from malicious software or botnet on the infected machine.
March 2018
- Username and IP Anonymization
- Cisco Web Security Appliance (WSA) 11.5 now allows you to send custom W3C logs to CTA for analysis. This is configured in WSA 11.5 using a new CTA page in the web user interface. In cases involving upstream proxy deployments, WSA 11.5 now allows you to include a new log field (r-ip) that specifies the website's IP address. In WSA 11.5, you can also anonymize the username, IP address, and user group values. This anonymization helps prevent the disclosure of client-related information in logs uploaded to external systems such as CTA.
- Stealthwatch Trial License Support for Stealthwatch 6.10.3 and Stealthwatch 7.0
- URL–Based Neural Network Classifier for High-Risk Malware
- CTA can now detect high-risk malware with a new convolutional neural network (CNN) classifier. The classifier is based on URL strings which are passed directly to the internal model. Therefore, no manually-predefined features are required. This classifier is the first in a series of neural network classifiers that we plan to deliver and extends CTA's capability to detect new and previously unseen network threats.
- This is an example of an incident triggered by the classifier:
February 2018
- Stealthwatch and Encrypted Traffic Analytics (ETA) Enhancements
- Support of Stealthwatch Reset to Factory Defaults (RFD) in CTA Integration - Users can now reset their devices without notifying TAC first (in order to maintain their CTA integration active).
- On-demand ETA Detections in Lab Environments. See Cognitive and ETA Detections in Lab Environments.
- Stealthwatch Read-Only role is supported in CTA portal.
- New Malicious Hosting Detector identifying endpoints associated with malicious hosting activity. See CTA Updates - New Malicious Hosting Detector.
- Behavioral Device Detection. Delivers the ability to distinguish multiple devices of a single user, when triggering CTA incidents.
January 2018
- Cryptocurrency Miner Detection. CTA Engine now detects new types of incidents:
- Repetitive and persistent cryptomining activities on the endpoint
- In-browser cryptomining by websites
- For more details, see CTA Updates - Cryptocurrency Miner Detection.
November 2017
- Encrypted Traffic Analytics
- Enhances existing Stealthwatch / CTA integration with malware detection capability for encrypted traffic without decryption. This capability addresses the need for customers to know if specific payload in network traffic is malicious while balancing privacy and security.
- Using new enhanced network contextual data, we are able to identify malware in encrypted traffic. It is done through inference using multiple sources of data, there is no decryption or inspection of traffic content, privacy is maintained at all times.
- Carefully designed machine learning architecture well balanced between unsupervised and supervised learning methods provides ability to detect new threats leveraging encrypted communication channels, while maintaining high level of accuracy and presenting findings prioritized for fast incident response.
- New and updated algorithms using ETA features in StealthWatch-flows were implemented to detect: Malware family Cryptowall, Sality, and Ramnit, Malicious file downloads, Phishing, DNS sinkhole, Vulnerability scanning, Typo-squatting, Unicode typo-squatting
- Unique in industry is the detection capability from HTTPS telemetry without decryption.
- Integration Verification/Test Incidents
- Possibility for customers and field was added to generate on-demand test incidents in their lab to validate Stealthwatch, AMP for Endpoints, ISE or general SIEM integrations.
- For more details, see CTA Updates in Detail: November 2017.
October 2017
- Advanced Stealthwatch Flow Record Classification Capability
- Enhanced anomaly detection. Added a new set of anomaly detectors for Stealthwatch flow records. This improves efficacy and provides contextual information of individual incidents. New types of incidents added: detections of Stealthy Command and Control communication channels, Unexpected DNS usage and Malicious SMB service discovery typical for fast-spreading malware such as WannaCry.
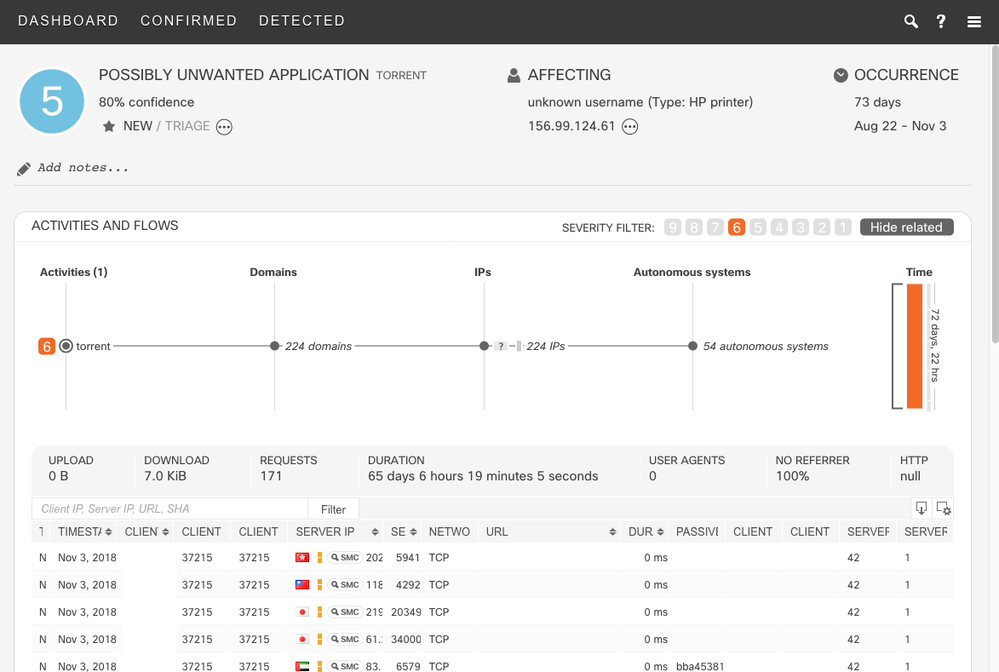
- Enhanced P2P analytics. Detects BitTorrent clients in the network. The detection is independent of used ports and transferred data, as well as any other network flow statistics. Therefore, the detector is able to detect active BitTorrent clients in the network that use non- standards (randomized) ports and do not actively participate in file sharing activity.
- Enhanced Data Filtering. Data sent to the Cognitive Analytics engine is filtered so that only flow records that cross the network perimeter are sent to the cloud. The enhancement in v6.10 adds the possibility for the user to modify the data that is sent by adding internal host groups to be monitored by the Cognitive Analytics engine.
- Incident Detail. New pivot point from within the CTA portal over to Stealthwatch Management Console (SMC) to further investigate an activity of a particular remote IP. There are new links next to the remote IP addresses that will open up the Stealthwatch Management Console (SMC) Host Reports for that particular IP.
- For more details, see CTA Updates in Detail: October 2017.
September 2017
- Added a Stealthwatch option to the login page.
- Improved the "Likely domain" description for a remote IP in parallel coordinates and flows table.
- In the "Add device account" wizard, replaced the "Select upload method" step with an "Upload Method" dropdown at the top of the page.
- Replaced the "Terminate Manual Upload" button at the bottom of the page with the "Upload Method" dropdown at the top of the page.
- On the Incident Detail page, new label indicates incidents detected using Encrypted Traffic Analytics.
- On the Incident Detail page, in the Type column, capital E indicates flows with information from Encrypted Traffic Analytics.
May 2017
- Domains, IPs, and autonomous systems are grouped into a single node in the parallel coordinates graph on the Incident Detail page if there are too many of them related to an activity.
- Show "Likely domain" for remote IP when this information is available without resolving IP to domain.
- In the Incident Detail page, columns in the Flows table are now based on Customer's data (WebFlow or NetFlow).
April 2017
- Data exposure page added. View information about data that has been exposed to specific threat behaviors.
January 2017
- On the CTA Login page, Cloud Web Security renamed to Web Security.
- On the DASHBOARD page, the print button in the main navigation opens the system print dialog.
November 2016
- Design and user experience of the Incident Detail page enhanced.
August 2016
- On the Incident Detail page, filtering by severity has been simplified.
- CTA no longer supports Microsoft Internet Explorer versions 10 and older.
- Introduced a new DASHBOARD page that provides a point-in-time overview of your network:
- Unresolved users grouped by risk category. A high number of lower risk threats may lead to more serious threats over time.
- Threat exposure based on number of incidents and their risk, compared to other companies within the same sector, similarly sized companies, all companies globally.
- Unresolved behaviors in your network.
- Unresolved incidents that currently pose the highest risk to your network.
- Unresolved incidents that recently showed an increase in risk.
July 2016
- Login page updated to support signing on using Cisco SSO.
June 2016
- In the CONFIRMED threats section, the confirmed threat risk color corresponds to the recommended remediation action.
- STIX/TAXII API provides risk and riskCategory values.
April 2016
- In all the incident tables, risk values are changed to reflect also confidence. Confidence moved to a separate column, which is hidden by default.
- In all the incident tables, risk icons have pop-ups with description and recommended remediation action.
- In the DETECTED threats section, new checkbox Show low confidence allows to show/hide incidents with confidence less than or equal to 85%.
- In the DETECTED threats section, Incident Response Guide download link replaced with a dialog box.
March 2016
- Further improvements to Manual Log Upload page.
February 2016
- Improved user experience of Manual Log Upload page and added new Log Validation Tool.
- In the Incident Detail page, added new AnyConnect Process Hash column to the Web Flows table.
- Fixed: Web Flows table CSV export now contains correct values for Client IP, Client Port, Server IP, and Server Port.
- Fixed: Load more button in tables containing incidents is now hidden when there is no more data to load.
- We've launched a new landing page for Cognitive Threat Analytics (CTA) at https://cognitive.cisco.com. It provides LOGIN for existing customers, SAMPLE BREACH REPORT for anyone interested in the technology and a web form to sign up for EVALUATION.
- Visual style of MANUAL upload page was improved to ensure better user experience.
- In the Device Accounts settings page, MANUAL UPLOAD method allows you to upload proxy log files directly from browser. You may check if your logs are in supported format in Validation screen.
January 2016
- Fixed issue where a permanent filter with a full CIDR range (e.g. 0.0.0.0/0) would cause the CONFIRMED threats section to not be loaded.
- Indication of incidents that are older than 90 days (whose data may be incomplete) is now correctly displayed on the incident detail page.
December 2015
- The incident state Triage renamed to New. The first tab name stays Triage as it also contains Reoccurring Remediated incidents.
- In the incident detail page, the indication of Reoccurring incident is shown.
- In the incident detail page, the related confirmed threats are shown.
- In the DETECTED threats section, Incident table column, all related confirmed threats are shown in a drop-down.
- Fixed: Incident marked immediately as Reoccurring after resolving if there is recent traffic.
- Fixed: Triage tab shows False Positive incidents in some cases.
- Fixed: In the incident detail, parallel coordinates, WHOIS information shows created/updated of Jan 1, 1970.
- STIX/TAXII account configuration page is extended by more details and example queries.
- In the DETECTED threats section, if an incident is part of multiple CONFIRMED threats, a drop-down listing all of them is shown.
- In the incident detail, webflows table, there is a new button for CSV download of all the incident web flows.
- In the CONFIRMED threats section, the paragraph explaining the dates and number of users was removed. Help tooltips were added to the same numbers at the top of the page instead.
- In all the incident tables, a new Persistent column was added. It is hidden by default.
- Incident states modified: NEW changed to TRIAGE, added new state REMEDIATING, RESOLVED as THREAT changed to RESOLVED as REMEDIATED.
- REOCCURRING incidents are present in TRIAGE tab.
- In the CONFIRMED threats section, the list of threats can be filtered based on the states of incidents.
- In the CONFIRMED threats section, the list of threats displays visually the progress of remediation.
- In the CONFIRMED threats section, Global Intelligence, Common Files, the file paths grouping improved, additional behavioral indicators implemented.
- Colors are now used only for risk/severity levels and not for incident states.
- Incident tables load time improved.
- Fixed: VRT Report tooltip not displaying correctly in IE 9.
November 2015
- In the CONFIRMED threats section, Affected Users, the mouse click filters the table of incidents for particular user. By default, the users with all incidents resolved are hidden.
- Fixed: Full Read Only user role used to have write access to Threats tab content.
October 2015
- Fixed: In the Device Accounts, SCP, if the public key had whitespace around, it was not possible to upload telemetry.
- Fixed: In the CONFIRMED threats section, Affected Users, user names were duplicate in some cases.
September 2015
- Incidents are marked reoccurring only if new malicious traffic is detected, not when the system updates the incident.
- In the DETECTED incidents section, the default time range is 45 days. The button labels now show number of days.
- In all the incident tables, the Occurrence column is renamed to Duration. The first row in each cell shows the incident duration. Column sorting is based on duration, not the start date.
- The icon indicating persistent threat changed to an icon similar to "repeat" in playlists.
- In the affected users graph, the last day shown is yesterday, since today may be empty from no data yet and suggest that the threat is not happening anymore.
- In the CONFIRMED threats section, the search box above the threats list has been removed.
- Keyboard scrolling is supported on all pages.
- Fixed: Notes in multi-byte characters (e.g. Asian languages) are saved correctly.
- Fixed: In the CONFIRMED threats section, the Global Intelligence caption is hidden if no data is available.
- Fixed: In the CONFIRMED threats section, Affected Users, user names were missing for incidents hidden by permanent filter.
August 2015
- VRT Sandbox report does not indicate malicious/clean anymore, since this information does not take other AMP intelligence into account and can be misleading. It displays only score.
- Styling improvements
- Detected Threats page renamed to Detected Incidents.
- Support page with contact information added.
July 2015
- In the CONFIRMED threats section, information on common files is introduced in Global Intelligence. Behavioral indicators that modify or create files are grouped by the similarity of the file paths or names. Includes the likelihood of these files being on the endpoints based on the percentage of samples that produce them.
- The Resolved as Threat state can now automatically transition to the Reoccurring Threat state. It is set if there is new information added after the state is set to Resolved as Threat. Number of such incidents is shown in the Threats tab.
- ADD DEVICE ACCOUNT wizard and DEVICE ACCOUNTS page improvements and bug fixes (Beta customers only).
- Ability to add SSH key for SCP configured proxies from DEVICE ACCOUNTS page after creating a device account.
- Ability to remove configured proxies from DEVICE ACCOUNTS page.
- Added UPLOAD LOGS page for every device account for detailed device account troubleshooting.
- Separate login to CTA report available at https://td.cloudsec.sco.cisco.com/CWSP/
- Ability to configure on-premise proxies to upload web logs for inspection (Beta customers only).
June 2015
- Web flow table can be resized.
- The global search also works across the incident notes.
May 2015
- Tooltips across the application unified.
- Fixed: Some large incidents were freezing the browser. A warning message is shown instead and incident details are not available.
- Fixed: Some incidents starting more than 3 months ago were not accessible, a message "The requested incident does not exist" was shown instead.
April 2015
- New column named FLOWS BLOCKED in the incidents table shows what percentage of flows blocked in all traffic that was determined to be anomalous.
- User interface style updates.
- Added link to CTA TAXII Service in settings button.
- Search feature accessible from the menu bar below the Threats tab searches through all incidents from the entire history of User Name, Client IP and Incident Name fields.
- Export CSV button downloads incidents from the current filter in both DETECTED and CONFIRMED tables into a CSV file.
- Permanent filter moved to the global settings menu and is applied across both DETECTED and CONFIRMED sections.
- CONFIRMED section now includes the number of incidents in the New and Investigating states and provides links to the respective states in the incidents table at the bottom of the page.
- In the CONFIRMED section, when possible decoded URLs are shown.
- Operating system information in CONFIRMED section no longer shows version or browser info.
- DETECTED list of incidents now can include incidents from CONFIRMED threats. Includes a toggle button to turn this feature on or off. Clicking the CONFIRMED threat label opens the CONFIRMED threat detail.
- New column named PERSISTENT in the incidents table indicates if the incident contains traffic with repetitive communication.
March 2015
- In the CONFIRMED threats section, incidents now listed in a table like that in the DETECTED section.
- Incident ASSESSMENT and FEEDBACK renamed to STATE.
- New incident state called Investigating.
- In the table of incidents, incidents now show the beginning of any notes that were added in the incident details page.
- In the incident details page, new footer showing summary statistics for the selected web flows.
- In the parallel coordinates graph, domains that are targets for persistent connections are now highlighted in bold with PERS indicator.
- In the CONFIRMED threats section, the graph of affected users now fixed to the last 45 days.
- In the CONFIRMED threats section, new link called scroll to incidents added next to the affected users section.
- CONFIRMED threats now show a confidence level of 100%.
- In both CONFIRMED and DETECTED sections, fixed copy-and-paste of rich-text to the Notes field.
February 2015
- In the Confirmed threats section, new field enables you to add notes to the threat.
- In the Confirmed threats section, new label next to the threat indicates the percentage of known malicious traffic that was blocked for this threat in your network.
- For incidents that are part of a Confirmed threat, the top menu provides direct navigation to the Confirmed threat.
- E-mail notifications now include AMP retrospectives. E-mail notifications now separate confirmed threats and detected incidents.
- In the Detected incidents section, new LAST UPDATED column shows the time when either the incident was created or some ongoing traffic was last added. To help make it easier to find AMP retrospective incidents, this value is used to include the incident in the chosen From/To time range.
- In the Confirmed threats section, new subsection shows AMP Threat Grid information gathered from global intelligence samples, not samples from your network.
January 2015
- New reporting section named Confirmed added to the Threats tab.
- The Confirmed section groups malware by its exhibited behavior and reports associated information such as affected users, security signatures, and behavioral indicators.
- Incident details page now shows information about the operating system. If the incident relates to a proxy, the proxy flag is shown instead.
- Activity table on incident detail page was removed without any replacement.
- On the incident details page, the parallel coordinates graph can now be used to filter web flows. Select and click one or more nodes to show the associated web flows in the table below the graph.
- Hover over the URL in the web flows table. If the URL contains an encoded part, the system will try to decode it. If the system is successful, the decoded content will be shown.
November 2014
- It is now possible to select the whole time range (45 days) on Detected Threats page. It was previously limited to 30 days.
- Fixed: In Internet Explorer 11 it was not possible to close the table preferences pop-up by clicking outside. The pop-up had to be closed by clicking on the Preferences button again.
October 2014
- Incident overview screen can be now accessed using a link pointing to data, which are partially or completely expired. Time range is trimmed and only available incidents are shown.
- Fixed: Load more button was not shown in Internet Explorer 11 in Webflows dialog.
- It is possible to configure e-mail notifications to receive daily summary of new and updated threats.
- The timestamp of the last web logs data processed is in the page footer.
- The tooltip dialog for malicious files now contains more information: Signatures, Contacted Domains, Created Files.
- SSLv3 disabled to prevent POODLE attack.
- Information about timezone is provided for all date and time information displayed by the UI.
- Fixed: In Situation room activities were aggregated only by their name, not respecting their severity. Now only activities with the same name and severity are aggregated.
September 2014
- Fixed: Permanent filter dialog did not operate correctly when the dialog was opened for the first time.
- It is now possible to close the modal dialog by clicking outside the dialog to the greyed out area.
- Further loading time improvements, when the page is accessed for the first time.
- Correlated incident hash tags added. In Situation room you can see incidents with hash tags indicating that these incidents have similar behavior and the given machines might be infected by the same malware. You can click on the hash tag to filter all incidents with the same behavior.
- In Parallel coordinates graph, when domain or IP tooltip is shown, links to SenderBase and ThreatGrid are shown to make the investigation using CTA and these tools more smooth.
- Page load speed improvement. The page should load faster when accessed for the first time.
- The highlighting of similar strings is now enabled in the webflow dialog for additional columns (User Agent, Header Content Type, Body Content Type, Filename, Category, SHA-256).
- Fixed: Show contextual activities button is now shown in Situation Room (previously the button was not shown, but all activities were present, including the contextual ones).
- Web flow dialog is now paginated, when String filters and ordering are used, they apply to the whole set of web flows.
- It is now possible to force showing of all activities in parallel coordinates graph in Situation Room. Till now there was a limit that did not allow to show the graph for big incidents.
- Detected Threats table now allows to set negative filter, which will hide all incidents with given client IP range. This tool is intended to be used for hiding of visitors subnet or other parts of the network that are not under you control.
- Your preferences (column ordering, column sizes, visibility of columns...) are now stored in our database. This change allows you to use the personalized UI on different devices.
August 2014
- First page table (Detected threats) is now paginated. When the filters are used (CTA/AMP, text filter...), they apply to all incidents, not only to those visible.
- Severity calendar component was removed from the first page.
- It is now possible to open Situation room in a new tab (window). To achieve this, please right click an incident shown in Detected Threats table and choose Open incident in a new window.
- New attributes - Platform Architecture and Operating System are now shown in the sandboxing tooltip in the web flow dialog.
- This dialog was added.
- In the web flow dialog, SHA256 column, there might appear an icon showing the result of AMP sandboxing result. The pop-up on that icon provides a link to the full sandbox report.
- In the situation room - user details banner, when the user IP is hovered, a tooltip containing all IP address assignments is shown. This tooltip contains time ranges in which the given IP address was used by user.
- When Web Browsing history button is clicked, the time range to perform the search is now set to the range of the current incident (was: 30 days).
- The list of detected threats is loaded by ajax, so the page is more responsive.
Find answers to your questions by entering keywords or phrases in the Search bar above. New here? Use these resources to familiarize yourself with the community:

