- Cisco Community
- Technology and Support
- Networking
- Switching
- Re: Catalyst 2960S problem
- Subscribe to RSS Feed
- Mark Topic as New
- Mark Topic as Read
- Float this Topic for Current User
- Bookmark
- Subscribe
- Mute
- Printer Friendly Page
Catalyst 2960S problem
- Mark as New
- Bookmark
- Subscribe
- Mute
- Subscribe to RSS Feed
- Permalink
- Report Inappropriate Content
06-17-2010 07:25 PM - edited 03-06-2019 11:38 AM
Hi,
I have 4 Catalyst 2960S, and they have the same problem.
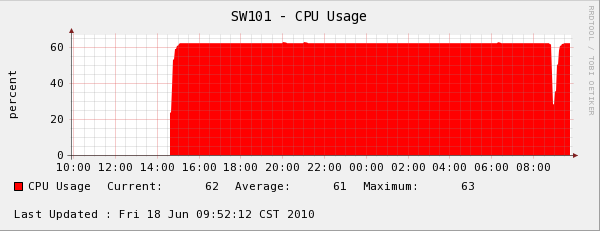
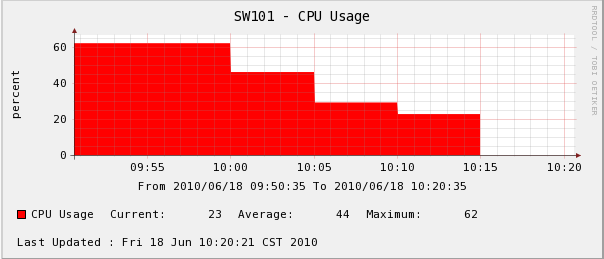
The CPU usage is 60% before I telnet them.
It fell to 20% when I using telnet to login. And raised to above 60% after logout.

This is the output of 'show proc cpu' when I login.

This is the output of 'show proc cpu' 2 mins later.

And the traffic chart will like this.

How can I to solve this problem?
The hardware & software version is:
WS-C2960S-48TS-L 12.2(53)SE1 C2960S-UNIVERSALK9-M
Many thanks for any comments.
- Labels:
-
Other Switching
- Mark as New
- Bookmark
- Subscribe
- Mute
- Subscribe to RSS Feed
- Permalink
- Report Inappropriate Content
08-27-2010 07:57 AM
I know bug CSCth24278 is listed as cosmetic, but I think that may be wrong. When we have high CPU, we are seeing packet loss on the switch. We then connect a telnet session, CPU lowers, and packet loss stops. Disconnect the telnet session, packet loss resumes.
We have a TAC case open documenting all of this.
- Mark as New
- Bookmark
- Subscribe
- Mute
- Subscribe to RSS Feed
- Permalink
- Report Inappropriate Content
08-31-2010 12:32 AM
We are experiencing the same problem and 12.5(55)SE does not fix the cpu bug.
- Mark as New
- Bookmark
- Subscribe
- Mute
- Subscribe to RSS Feed
- Permalink
- Report Inappropriate Content
08-31-2010 04:58 AM
Thanks for the info, that'll save me some work
- Mark as New
- Bookmark
- Subscribe
- Mute
- Subscribe to RSS Feed
- Permalink
- Report Inappropriate Content
10-15-2010 02:04 AM
We are having the same Problem too.
#show processes cpu history


    2223222222228222222223222369666666666666669666666666666696
    8897787757889775899890865119130333135431413133253322443111
100                            *
 90             *              *              *             *
 80             *              *              *             *
 70             *              *        *     *    *        *
 60             *             *###############################
 50             *             *###############################
 40    *        *             *###############################
 30 ************#*************################################
 20 ##########################################################
 10 ##########################################################
   0....5....1....1....2....2....3....3....4....4....5....5....
             0    5    0    5    0    5    0    5    0    5
               CPU% per minute (last 60 minutes)
              * = maximum CPU%   # = average CPU%

    9999999999999999999999999999999999999999999999999999999999999999999999
    9998999899699999998889989889899899999899899999999998999999999999988798
100 **********************************************************************
 90 **********************************************************************
 80 **********************************************************************
 70 **********************************************************************
 60 *################*********#########################################***
 50 ##################*******###########################################**
 40 ##################*******###########################################**
 30 ###################******###########################################**
 20 ######################################################################
 10 ######################################################################
   0....5....1....1....2....2....3....3....4....4....5....5....6....6....7.
             0    5    0    5    0    5    0    5    0    5    0    5    0
                   CPU% per hour (last 72 hours)
                  * = maximum CPU%   # = average CPU%
Where you can see the gaps i was logged in via ssh.
There are serious Performance Problems in our network.
I found some strange outputs:
If i enter show platform port-asic stats drop
Port-asic Port Drop Statistics - Summary
========================================
  Port  0 TxQueue Drop Stats: 0
  Port  1 TxQueue Drop Stats: 121840
  Port  2 TxQueue Drop Stats: 0
  Port  3 TxQueue Drop Stats: 239
  Port  4 TxQueue Drop Stats: 0
  Port  5 TxQueue Drop Stats: 8174
  Port  6 TxQueue Drop Stats: 17
  Port  7 TxQueue Drop Stats: 197598
  Port  8 TxQueue Drop Stats: 0
  Port  9 TxQueue Drop Stats: 0
  Port 10 TxQueue Drop Stats: 0
  Port 11 TxQueue Drop Stats: 0
  Port 12 TxQueue Drop Stats: 0
  Port 13 TxQueue Drop Stats: 0
  Port 14 TxQueue Drop Stats: 0
  Port 15 TxQueue Drop Stats: 16
  Port 16 TxQueue Drop Stats: 0
  Port 17 TxQueue Drop Stats: 16
  Port 18 TxQueue Drop Stats: 0
  Port 19 TxQueue Drop Stats: 679
  Port 20 TxQueue Drop Stats: 242
  Port 21 TxQueue Drop Stats: 0
  Port 22 TxQueue Drop Stats: 359
  Port 23 TxQueue Drop Stats: 0
  Port 24 TxQueue Drop Stats: 16
  Port 25 TxQueue Drop Stats: 0
  Port 26 TxQueue Drop Stats: 0
  Port 27 TxQueue Drop Stats: 0
I don't think, that this dropping is normal. I will continue trying to solve the Problem.
Greetings,
Benjamin
- Mark as New
- Bookmark
- Subscribe
- Mute
- Subscribe to RSS Feed
- Permalink
- Report Inappropriate Content
10-15-2010 02:13 AM
This is what one of our switches reports after we just ha
ve telented into it. The CPU drops to a normal level just after we telnet to it.
11111555555555555555555555555555555555555555555555555
6666622222000003333322222111112222211111444443333311111777
100
90
80
70
60 ***
50 ************************************************
40 ************************************************
30 ************************************************
20 ************************************************
10 **********************************************************
0....5....1....1....2....2....3....3....4....4....5....5....
0 5 0 5 0 5 0 5 0 5
CPU% per second (last 60 seconds)
5555555555555555555555555555555555555555555555555555555555
7667778587475557888685766865576765556757765565776566677465
100
90
80
70
60 ********** ******************************************** **
50 ##########################################################
40 ##########################################################
30 ##########################################################
20 ##########################################################
10 ##########################################################
0....5....1....1....2....2....3....3....4....4....5....5....
0 5 0 5 0 5 0 5 0 5
CPU% per minute (last 60 minutes)
* = maximum CPU% # = average CPU%
5555655566655565555555555655655655565665565565656666556555556555556655
9989199900099909988989998098099088909009919909090100990899990999980099
100
90
80
70
60 **********************************************************************
50 ######################################################################
40 ######################################################################
30 ######################################################################
20 ######################################################################
10 ######################################################################
0....5....1....1....2....2....3....3....4....4....5....5....6....6....7.
0 5 0 5 0 5 0 5 0 5 0 5 0
CPU% per hour (last 72 hours)
- Mark as New
- Bookmark
- Subscribe
- Mute
- Subscribe to RSS Feed
- Permalink
- Report Inappropriate Content
10-27-2010 06:52 AM
I have the same problem
stack group as follow:
switch 1 provision ws-c2960s-48lps-l
switch 2 provision ws-c2960s-48ts-l
switch 3 provision ws-c2960s-48ts-l
switch 4 provision ws-c2960s-48ts-l

- Mark as New
- Bookmark
- Subscribe
- Mute
- Subscribe to RSS Feed
- Permalink
- Report Inappropriate Content
11-10-2010 06:20 AM
Same problem here !

I'm happy I've found people with the same problem since I've already post regarding this issue :
At first, I thought I had a problem with my trunking settings (I'm not a Cisco expert) : https://supportforums.cisco.com/thread/2025472 then
https://supportforums.cisco.com/message/3222651
We did a waranty RMA since I thought the switch was faulty!
- Mark as New
- Bookmark
- Subscribe
- Mute
- Subscribe to RSS Feed
- Permalink
- Report Inappropriate Content
11-15-2010 02:25 AM
Hi,
We have the same problem.
High CPU (80%) and packet loss. We then connect a telnet session, CPU lowers, and packet loss stops. Disconnect the telnet session, packet loss resumes.
Any news about software release 12.2.58 ??
/Magnus
- Mark as New
- Bookmark
- Subscribe
- Mute
- Subscribe to RSS Feed
- Permalink
- Report Inappropriate Content
11-15-2010 07:44 AM
Hey Magnus -- two questions...
What IOS are you currently at?
How long have your switches been up?
The high CPU bug is still waiting for 12.2(58). But there's another bug CSCtg77276 which affects 12.2(53) after 6 weeks of uptime. Although the public case notes on CSCtg77276 don't exactly mention it, my Cisco engineer informs me it could cause packet loss. Upgrading to 12.2(55) fixed our packet loss problem -- but the high CPU bug is still there.
Tom
- Mark as New
- Bookmark
- Subscribe
- Mute
- Subscribe to RSS Feed
- Permalink
- Report Inappropriate Content
11-15-2010 09:24 AM
Hi Tom,
Thanks for your response and information about the bug CSCtg77276.
Have you any information when 12.2(58) arrives?
The version is 12.2(53)SE2 and uptime is 5 weeks, 6 days, 8 hours, 29 minutes.
Best Regards
/Magnus
- Mark as New
- Bookmark
- Subscribe
- Mute
- Subscribe to RSS Feed
- Permalink
- Report Inappropriate Content
11-15-2010 09:27 AM
Unofficially from my TAC engineer I heard 12.2(58) will be early 2011. But given your problem (packet loss) and your uptime, I would give 12.2(55) a try. It won't fix your high CPU, but it may fix your packet loss.
Tom
- Mark as New
- Bookmark
- Subscribe
- Mute
- Subscribe to RSS Feed
- Permalink
- Report Inappropriate Content
11-15-2010 09:37 AM
Thanks!!
Have a nice day!
Best Regards
/Magnus
- Mark as New
- Bookmark
- Subscribe
- Mute
- Subscribe to RSS Feed
- Permalink
- Report Inappropriate Content
11-18-2010 01:40 AM
Hi Allan,
This is happening due to a cosmetic software defect, where you will observe the CPU load more than 50 - 60% on these switches when you do not access them however it immediately normalizes when you access it via console; telnet or SSH. This is purely cosmetic and does not hamper the network and services running on the device.
Please check the following Bug: CSCth24278 - High CPU when no Console/VTY activity, or more info about it.
Regards,
Vishal
- Mark as New
- Bookmark
- Subscribe
- Mute
- Subscribe to RSS Feed
- Permalink
- Report Inappropriate Content
11-18-2010 01:55 AM
Hi, Vishal,
Thanks for your reply. But even this issue is cosmetic.
It still hard to explain to my boss.
Could you help to push RD to correct this issue ASAP?
I think it would be quite easy if it's not a problem.
Thanks.
- Mark as New
- Bookmark
- Subscribe
- Mute
- Subscribe to RSS Feed
- Permalink
- Report Inappropriate Content
11-18-2010 02:03 AM
Hi Allan,
You can leave a PC connected on it via console, this will not let the CPU go high and even if you face the issue than it could happen due to some other triggers taking place in the network and not becuase of High CPU.
I hope this way you can give an explanation to your Boss.
Kindly note that the respective team is working on it and you will be notified as soon as some information goes public about it.
Regards,
Vishal
Discover and save your favorite ideas. Come back to expert answers, step-by-step guides, recent topics, and more.
New here? Get started with these tips. How to use Community New member guide
