- Cisco Community
- Technology and Support
- Service Providers
- Service Providers Knowledge Base
- ASR9000/XR Netflow Architecture and overview
- Subscribe to RSS Feed
- Mark as New
- Mark as Read
- Bookmark
- Subscribe
- Printer Friendly Page
- Report Inappropriate Content
- Subscribe to RSS Feed
- Mark as New
- Mark as Read
- Bookmark
- Subscribe
- Printer Friendly Page
- Report Inappropriate Content
on 09-26-2012 12:06 PM
- Introduction
- Basic configuration for netflow
- Scale parameters for netflow
- Netflow support
- Architecture
- Netflow Cache size, maintenance and memory
- Sample usage
- Cache Size
- Aging
- Which packets are netflowed?
- Sampling
- Monitoring netflow
- The exporter (MAP)
- Troubleshooting Netflow
- Exporter fields
- Not supported features
- Related Information
Introduction
This document decribes the ASR9000 netflow architecture.
It provides a basic configuration how to set up netflow and what the parameters are for scale and how netflow is implemented in the ASR9000/XR
Basic configuration for netflow
The basic configuration for netflow consists of an
Flow monitor map
An exporter map
and a sampler map.
The Flow monitor MAP pulls in the Exporter map
On the interface you want to enable netflow on, you pull in the monitor map and the sampler map.
flow monitor-map FM
record ipv4
exporter FE
cache permanent
cache entries 10000
! cache timeouts define how frequently we export what, max of 1M per LC
cache timeout active 2
cache timeout inactive 2
!
flow exporter-map FE
version v9
options interface-table timeout 120
! these 2 define the exports of the sample map and interface table to theflow collector for sync'ing indexes
! to names etc.
options sampler-table timeout 120
!
transport udp 1963
destination 12.24.39.1
source <interfacename>
!
sampler-map FS
random 1 out-of 1
interface GigabitEthernet0/0/0/20
description Test PW to Adtech G4
ipv4 address 16.1.2.1 255.255.255.0
flow ipv4 monitor FM sampler FS ingress
!
Scale parameters for netflow
Ø    Trident: 100kpps/LC (total, that is in+out combined)
       Typhoon: 200kpps/LC
Ø   1M records per LC  (default cache size is 64k)
Ø   50K Flows per sec export per LC
Ø   Sample intervals from 1:1 to 1:64k
Ø Up to 8 exporters per map, vrf aware
Netflow support
Architecture
Netflow is not hardware accelerated in the ASR9000 or XR for that matter, but it is distributed.
What that means is that each linecard individually runs netflow by itself.
Resources are shared between the interfaces and NPU's on the linecard.
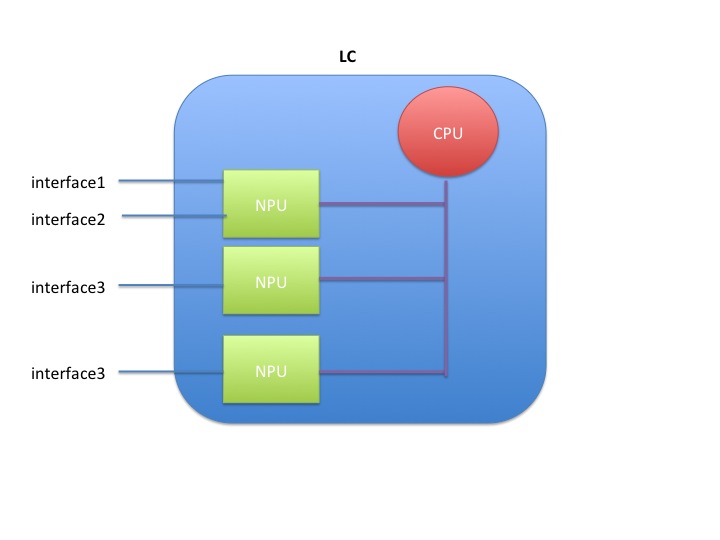
When you have 1 interface to one NPU on one linecard enabled for netflow, the full rate is available to that interface, which is 100k pps for trident and 200k for typhoon.
When you enable 2 interfaces on the same NPU on the same LC, then both interfaces share the 100k pps (trident) or 200k pps (typhoon)
When you enable 2 interfaces on 2 different NPU's, then both NPU's share the total rate of 100k/200k amongst them giving each NPU 50k or 100k depending on the LC type.
Packet flow for netflow
Inside the LC CPU

Netflow Cache size, maintenance and memory
In IOS-XR platforms, it is the LC processor memory that holds the netflow cache.
NetFlow Cache is a Section of memory that stores flow entries before they are exported to external collector.
The ‘nfsvr’ process running on the linecard, manages the netflow cache.
Memory usage
The memory used can be monitored via this command:
show flow monitor FM cache internal location 0/0/CPU0
...
Memory used: 8127060
Total memory used can be verified by checking the process memory util of "NFSVR"
show processes memory location 0/0/CPU0 | inc nfsvr
257 139264 65536 73728 12812288 nfsvr
Sample usage
The memory used with the cache size of default 64k entries for ipv4 & MPLS is about 8MB & for ipv6 is about 11MB.
The memory used with the cache size of maximum 1M entries for ipv4 & MPLS is about 116 MB & for ipv6 is about 150MB.
The memory used with cache size of maximum 1M entries (default is 65535) is about 116 MB per ipv4 flow monitor .
If ‘n’ ipv4 flow monitors are used all with maximum 1M entries, the memory used would be n x 116 MB.
Cache Size
Configuration to set the cache entries to ten thousand looks as follows:
flow monitor-map FM
cache entries 10000
Aging
95% of configured cache size is the high watermark threshold. Once this threshold is reached, certain flows (longest idle ones etc) are aggressively
timed out. XR 4.1.1 attempts to expire 15% of the flows.
The show flow monitor FM cache internal location 0/0/cpu0 command will give you the data on that:
Cache summary for Flow Monitor :
Cache size: 65535
Current entries: 17
High Watermark: 62258
NETFLOW-6-INFO_CACHE_SIZE_EXCEEDED
this syslog message means that we wanted to add more entries to the cache than what it could hold. There are a few different reasons and remediations for it:
- the cache size is too small, and by enlarging it we can hold more entries
- the inactive timeouts are too long, that is we hold entries too long in the cache not getting aged fast enough
- we have the right size cache, and we do export them adequately, but we are not getting the records out fast enough due to volume, in that case we can tune the rate limit of cache expiration entries via:
flow monitor <name> cache timeout rate-limit <time>
Permanent cache
The permanent cache is very different from a normal cache and will be useful for accounting or security monitoring. The permanent cache will be a fixed size chosen by the user. After the permanent cache is full all new flows will be dropped but all flows in the cache will be continuously updated over time (i.e similar to interface counters).
Note that the permanent cache uses a different template when it comes to the bytes and packets.
When using this perm cache, we do not report fields 1 and 2, but instead use 85 and 86.
Fields 1 and 2 are “deltas” 85 and 86 are "running counters".
In your collector you need to "teach" it that 1 and 85, 2 and 86 are equivalent.
Characteristics
Which packets are netflowed?
All packets subject to sampling, regardless or whethe they are forwarded or not are subject to netflow.
This includes packets dropped by ACL or QOS policing for instance!
A drop reason is reported to NF..
* ACL deny
* unroutable
* policer drop
* WRED drop
* Bad IP header checksum
* TTL exceeded
* Bad total length
* uRPF drop
Example
IPV4SrcAddr      IPV4DstAddr      L4SrcPort  L4DestPort IPV4Prot IPV4TOS InputInterface  ForwardStatus        ByteCount    PacketCount  Dir

17.1.1.2         99.99.99.99      3357       3357       udp      0     Gi0/1/0/39      DropACLDeny          415396224    8654088      Ing
Sampling
As described in the architecture section, the total sampling capability depends on the number of interfaces having netflow enabled.
It shaped up to be something like this table:
|
# of NPs Enabled for Netflow |
Policing Rate Per Trident NP (Unidirectional) |
Policing Rate Per Typhoon NP (Unidirectional) |
|
1 |
100kpps |
200kpps |
|
2 |
50kpps |
100kpps |
|
3 |
33kpps |
66kpps |
|
4 |
25kpps |
50kpps |
Punt Policing of netflow packets
All packets that exceed this rate are dropped by the punt policer.
You can verify that by the controllers np counters command.
show controllers np counters all
Node: 0/0/CPU0:
----------------------------------------------------------------
Show global stats counters for NP0, revision v2
Read 67 non-zero NP counters:
Offset Counter FrameValue Rate (pps)
-------------------------------------------------------------------------------
....
934 PUNT_NETFLOW 18089731973 6247
935 PUNT_NETFLOW_EXCD 6245 0
...
The _EXCD depicts that the police rate had been exceeded.
This means that you likely have to increase your sampling interval.
Monitoring netflow
sh flow monitor FM cache format table include layer4 tcp-flags ipv4 sour dest prot tos count pack byte location 0/0/CPU0
Mon Apr 19 09:31:19.589 EDT
Cache summary for Flow Monitor FM:
Cache size: 10000
Current entries: 1
High Watermark: 9500
Flows added: 1
Flows not added: 0
Ager Polls: 580
- Active timeout 0
- Inactive timeout 0
- TCP FIN flag 0
- Watermark aged 0
- Emergency aged 0
- Counter wrap aged 0
- Total 0
Periodic export:
- Counter wrap 0
- TCP FIN flag 0
Flows exported 0
IPV4SrcAddr IPV4DstAddr IPV4Prot IPV4TOS L4TCPFlags ByteCount PacketCount
16.1.2.2 16.1.1.2 tcp 0 S| 4282560 71 376
Matching entries: 1
The exporter (MAP)
Export occurs when data in the cache is removed which can occur in one of three ways.
- Inactive timer expiry : The cache entry expires due to not matching an incoming packet for a specified amount of time. Default value is 15 seconds.
- Active timer expiry : The cache entry, though still matching incoming packets, has been in the cache so long that it exceeds active timer. Default value is 30 minutes
- Cache Exhaustion : The cache becomes full, so some of the oldest entries are purged to make room for new entries.
The netflow exporter can be in a VRF, but can not be out of the Mgmt Interface.
Here’s why. The netflow runs off of the line card (LC interfaces and NP) and there is, by default, no forwarding between the LCs and the management Ethernet.

This because the MGMT ether is designated out of band by LPTS (local packet
transport services). More detail in the ASR9000 Local packet transport services
document here on support forums).
Netflow records can be exported to any destination that may or may not be local to the LC where netflow is running. For example, LC in slot 1 & 2 are running netflow & the exporter may be connected to an interface reachble via LC in slot 3.
A total of 8 exporters per MAP is allowed.
Troubleshooting Netflow
Tue Nov 16 11:23:41.437 EST
Flow Exporter: FE
Flow Exporter memory usage: 3280812
Used by flow monitors: FM
Transport UDP
Destination 3.0.0.38 (1963)
Source 0.0.0.0 (12162) <<<<<<< PROBLEM!!
Flows exported: 0 (0 bytes)
Flows dropped: 0 (0 bytes)
.....
Exporter fields
Flow record key fields
- IPv4 source & destination addresses
- IPv4 protocol & TOS byte
- Transport source & destination ports
- Input interface
- Direction
- Forwarding status
- BGP next-hop
Flow record non-key fields
- TCP flags
- IPv4 source & destination prefix mask length
- Source & destination BGP AS #
- IPv4 address of BGP next hop
- Packet & byte counters
- First & last packet timestamps
- Output interface
Not supported features
Ø DBNA
Ø Cisco netflow mib is not supported.
Related Information
Netflow cache size considerations
Recent enhancements
Show commands
show flow exporter-map ..
show flow monitor-map ..
show sampler-map ..
show processes memory location <0/0/CPU0> | inc nfsvr
show flow monitor .. cache internal location <0/0/CPU0>
show flow exporter .. location <0/1/CPU0>
show flow platform producer statistics location <0/0/CPU0>
show flow platform nfea policer np <np_num> loc <node-id>
show controller np ports all location <0/Y/CPU0>
show controller np count np<number> loc <0/Y/CPU0>
 - Emeritus")
- Mark as Read
- Mark as New
- Bookmark
- Permalink
- Report Inappropriate Content
hi Evan,
this Bundle-Ether12.3481 is an L3 interfaces that inherits all attributes from Loopback3401. Loopback3401 won't in any way be used to forward traffic, so netflow on a Loopback interface doesn't have any effect. This netflow config should work.
One point I want to draw your attention to is that using unnumbered interfaces in this way is not a typical deployment scenario. Unnumbered is typically used in BNG on subscriber access interfaces.
hope this helps,
/Aleksandar
- Mark as Read
- Mark as New
- Bookmark
- Permalink
- Report Inappropriate Content
I have a strange one that perhaps you can help with. I am exporting netflow from my ASR9010s to two different parallel systems:
flow exporter-map nfsen
 transport udp 9995
 source Loopback0
 destination x.x.197.75
!
flow exporter-map iucc-flow
 transport udp 9993
 source Loopback0
 destination x.x.197.193
!
flow monitor-map fmp-nfsen
 record ipv4
 exporter nfsen
 exporter iucc-flow
 cache entries 12000
 cache timeout active 60
 cache timeout inactive 15
!
sampler-map fsm-nfsen
 random 1 out-of 1
The one exporting to 9993 works fine whereas the one exporting to 9995 keeps have hiccups and large delays between pkts.
RP/0/RSP0/CPU0:petach-tikva-gp#sho flow exporter nfsen loca 0/0/cpu0
Thu Jul 20 08:24:29.227 IDT
Flow Exporter: nfsen
Flow Exporter memory usage: 3281086
Used by flow monitors: fmp-nfsen
Status: Normal
Transport: UDP
Destination: x.x.197.75 (9995) VRF default
Source: x.x.220.91 (11013)
Flows exported: 8318120006 (540677800390 bytes)
Flows dropped: 0 (0 bytes)
Templates exported: 8123176 (812317600 bytes)
Templates dropped: 0 (0 bytes)
Option data exported: 0 (0 bytes)
Option data dropped: 0 (0 bytes)
Option templates exported: 38010 (1013600 bytes)
Option templates dropped: 0 (0 bytes)
Packets exported: 417956030 (1084996969966 bytes)
Packets dropped: 0 (0 bytes)
Total export over last interval of:
 1 hour: 63323 pkts
 82827000 bytes
 1265762 flows
 1 minute: 1052 pkts
 1381964 bytes
 21119 flows
 1 second: 0 pkts
 0 bytes
 0 flows
RP/0/RSP0/CPU0:petach-tikva-gp#sho flow exporter iucc-flow loca 0/0/cpu0
Thu Jul 20 08:25:05.963 IDT
Flow Exporter: iucc-flow
Flow Exporter memory usage: 3281086
Used by flow monitors: fmp-nfsen
Status: Normal
Transport: UDP
Destination: x.x.197.193 (9993) VRF default
Source: x.x.220.91 (30387)
Flows exported: 8318135549 (540678810685 bytes)
Flows dropped: 0 (0 bytes)
Templates exported: 8136626 (813662600 bytes)
Templates dropped: 0 (0 bytes)
Option data exported: 0 (0 bytes)
Option data dropped: 0 (0 bytes)
Option templates exported: 32877 (876720 bytes)
Option templates dropped: 0 (0 bytes)
Packets exported: 416839937 (1084995250073 bytes)
Packets dropped: 0 (0 bytes)
Total export over last interval of:
 1 hour: 63353 pkts
 83001152 bytes
 1268427 flows
 1 minute: 1041 pkts
 1361808 bytes
 20810 flows
 1 second: 1 pkts
 592 bytes
 9 flows
My other router does 1:10 sampling but suffers the same issue. Is there anything specific with port 9995?
Thanks!
- Mark as Read
- Mark as New
- Bookmark
- Permalink
- Report Inappropriate Content
Could it be that doing multiple netflow causes the first to lose out and the second one defined to win out?
- Mark as Read
- Mark as New
- Bookmark
- Permalink
- Report Inappropriate Content
Two exporter maps are supported, this should work fine. What do you mean exactly by 'hiccups' and where is the delay observed? In the stats that you have pasted it appears that the router is exporting to both destinations correctly. What happens if you disable iucc-flow exporter and only leave nfsen?
/Aleksandar
- Mark as Read
- Mark as New
- Bookmark
- Permalink
- Report Inappropriate Content
I now checked
RP/0/RSP0/CPU0:petach-tikva-gp#show controllers np counters all | incl FLOW
Thu Jul 20 23:46:40.258 IDT
 936 PUNT_NETFLOW 12363595740 97
 937 PUNT_NETFLOW_EXCD 949214815 0
 936 PUNT_NETFLOW 244573411993 12137
 937 PUNT_NETFLOW_EXCD 191175777 0
 936 PUNT_NETFLOW 695718170239 11337
 937 PUNT_NETFLOW_EXCD 930690619832 0
 936 PUNT_NETFLOW 988195454835 43345
 937 PUNT_NETFLOW_EXCD 928992162628 0
Could this cause one of the two flow feeds to lose most of the pkts and the first one to not lose any?
- Mark as Read
- Mark as New
- Bookmark
- Permalink
- Report Inappropriate Content
that means that your sampling rate is too aggressive. that is there are more samples that can be punted.
this is unrelated to the exporter situation you have.
we can export an x number of flows per second. it could be that we are dropping on export due to queue exhaustion.
if you see from show flow export <name> <lc> any "packets dropped" they are the records that got tossed by netio.
if that value is zero, they did make it out.
one thing is that you will want to fix your source interface to use and it not going out of the mgmt rp interface.
xander
- Mark as Read
- Mark as New
- Bookmark
- Permalink
- Report Inappropriate Content
Hello,
I have a question about the 'cache timeout rate-limit'. The default value is 2000 entries per second. This ist too small for our amount of traffic (%MGBL-NETFLOW-6-INFO_CACHE_SIZE_EXCEEDED). What are the impacts on the LC performans if we increase the rate-limit to 5'000 or 10'000 ?
We have no idea. I can´t find any Cisco documentation about the 'cache timeout rate-limit'. Furthermore the command doesn´t exist in the Cisco Command Reference...
We have ASR9010 with Thyphoon LC A9K-24-10GE-TR, sampling rate: 1:50.
Kay
- Mark as Read
- Mark as New
- Bookmark
- Permalink
- Report Inappropriate Content
Hi Xander, I have some questions with expoter filed.
My customer check the trace of netflow on server, result as below.(using the netflow analysis tool) next-hop source AS des AS are all "0"
Date:20170911155002,ip:59.150.0.152,sIP[69.147.88.9], dIP[211.246.171.17], sPT[443], dPT[3919], prot[6], next[0.0.0.0], inIdx[15], outIdx[12], octets[1500], pkts[1], sAS[0], dAS[0], startTime[0] V9 Date:20170911155002,ip:59.150.0.152,sIP[31.13.68.51], dIP[182.31.98.138], sPT[443], dPT[37484], prot[6], next[0.0.0.0], inIdx[15], outIdx[12], octets[1450], pkts[1], sAS[0], dAS[0], startTime[0] V9
However, from the ASR9K which connected with this server, result as below.
next-hop ,source AS, des AS could be seen.
show flow monitor DreamLine-Monitor cache location 0/0/cPU0
IPV4SrcAddr IPV4DstAddr L4SrcPort L4DestPort BGPDstOrigAS BGPSrcOrigAS BGPNextHopV4 IPV4DstPrfxLen IPV4SrcPrfxLen IPV4Prot IPV4TOS InputInterface OutputInterface L4TCPFlags ForwardStatus FirstSwitched LastSwitched ByteCount PacketCount Dir SamplerID
27.0.236.54 124.153.156.54 80 49634 9694 38099 211.175.185.194 21 22 tcp 0 Te0/0/2/3 Te0/0/2/0 A| Fwd 45 10:35:02:645 45 10:35:02:760 3000 2 Ing 1
211.112.98.76 115.160.107.37 43006 61256 9694 17608 211.175.185.194 21 21 tcp 0 Te0/0/2/3 Te0/0/2/0 A| Fwd 45 10:34:50:769 45 10:34:50:769 1500 1 Ing 1
211.182.236.147 211.246.165.235 80 50356 9694 9706 211.175.185.194 21 16 tcp 0 Te0/0/2/3 Te0/0/2/0 A| Fwd 45 10:34:50:920 45 10:34:51:098 3000 2 Ing 1
A9K netflow configuration :
flow exporter-map DreamLine-Exporter
 version v9
 !
 transport udp 2055
 source Loopback0
 destination 211.242.172.206
!
flow monitor-map DreamLine-Monitor
 record ipv4
 exporter DreamLine-Exporter
!
sampler-map Netflow-Sample
 random 1 out-of 10000
interface TenGigE0/0/2/0
 description >>>Seokyung_C7609#1 [48C-21,22]0015-6508-0001[2013-11-25]
 ipv4 address 211.175.185.193 255.255.255.252
 load-interval 30
 flow ipv4 monitor DreamLine-Monitor sampler Netflow-Sample ingress
BGP configuration :
router bgp 9457
 bgp log neighbor changes detail
 address-family ipv4 unicast
  bgp attribute-download
  maximum-paths ebgp 4
  maximum-paths ibgp 5
 !
 neighbor 210.181.0.1
  remote-as 9457
  description << DCL1 >>
  update-source Loopback0
  address-family ipv4 unicast
   next-hop-self
   soft-reconfiguration inbound always
The customer want to know if this is expected behavious?
Is there any configuration could display the AS & nexthop on server?
- Mark as Read
- Mark as New
- Bookmark
- Permalink
- Report Inappropriate Content
Hello Xander.
Based on your document and other sources, I've long understood that exported netflow stats had to egress via a line card, that the egress port had to be directly addressable by the switching fabric. There was a sensible rational, and it explained some of my early experiences.
I was recently confronted with a challenge to this, and while trying to understand, saw your message from 03-05-2015 about the rp mgmtethernet forwarding command. This implies that the exported packets can egress through the RSP ports, which is a big enough challenge to my understandings, but the configuration running successfully on my collegue's ASR 9000 doesn't even have that command:
RP/0/RSP0/CPU0:CR2.ALB9#
RP/0/RSP0/CPU0:CR2.ALB9#
RP/0/RSP0/CPU0:CR2.ALB9#show plat
Mon Oct 2 09:22:37.378 EDT
Node Type State Config State
-----------------------------------------------------------------------------
0/RSP0/CPU0 A9K-RSP880-TR(Active) IOS XR RUN PWR,NSHUT,MON
0/RSP1/CPU0 A9K-RSP880-TR(Standby) IOS XR RUN PWR,NSHUT,MON
0/0/CPU0 A9K-MOD80-TR IOS XR RUN PWR,NSHUT,MON
0/0/0 A9K-MPA-4X10GE OK PWR,NSHUT,MON
0/0/1 A9K-MPA-4X10GE OK PWR,NSHUT,MON
0/1/CPU0 A9K-MOD80-TR IOS XR RUN PWR,NSHUT,MON
0/1/0 A9K-MPA-4X10GE OK PWR,NSHUT,MON
0/1/1 A9K-MPA-4X10GE OK PWR,NSHUT,MON
0/2/CPU0 A9K-MOD80-TR IOS XR RUN PWR,NSHUT,MON
0/2/0 A9K-MPA-4X10GE OK PWR,NSHUT,MON
0/2/1 A9K-MPA-4X10GE OK PWR,NSHUT,MON
RP/0/RSP0/CPU0:CR2.ALB9#
RP/0/RSP0/CPU0:CR2.ALB9#
RP/0/RSP0/CPU0:CR2.ALB9#
RP/0/RSP0/CPU0:CR2.ALB9#
RP/0/RSP0/CPU0:CR2.ALB9#show install active
Mon Oct 2 09:22:42.276 EDT
Secure Domain Router: Owner
Node 0/RSP0/CPU0 [RP] [SDR: Owner]
Boot Device: disk0:
Boot Image: /disk0/asr9k-os-mbi-5.3.4.sp3-1.0.0/0x100305/mbiasr9k-rsp3.vm
Active Packages:
disk0:asr9k-services-infra-5.3.4
disk0:asr9k-video-px-5.3.4
disk0:asr9k-optic-px-5.3.4
disk0:asr9k-mgbl-px-5.3.4
disk0:asr9k-k9sec-px-5.3.4
disk0:asr9k-bng-px-5.3.4
disk0:asr9k-services-px-5.3.4
disk0:asr9k-asr901-nV-px-5.3.4
disk0:asr9k-li-px-5.3.4
disk0:asr9k-mcast-px-5.3.4
disk0:asr9k-mini-px-5.3.4
disk0:asr9k-doc-px-5.3.4
disk0:asr9k-fpd-px-5.3.4
disk0:asr9k-9000v-nV-px-5.3.4
disk0:asr9k-mpls-px-5.3.4
disk0:asr9k-px-5.3.4.sp3-1.0.0
Node 0/RSP1/CPU0 [RP] [SDR: Owner]
Boot Device: disk0:
Boot Image: /disk0/asr9k-os-mbi-5.3.4.sp3-1.0.0/0x100305/mbiasr9k-rsp3.vm
Active Packages:
disk0:asr9k-services-infra-5.3.4
disk0:asr9k-video-px-5.3.4
disk0:asr9k-optic-px-5.3.4
disk0:asr9k-mgbl-px-5.3.4
disk0:asr9k-k9sec-px-5.3.4
disk0:asr9k-bng-px-5.3.4
disk0:asr9k-services-px-5.3.4
disk0:asr9k-asr901-nV-px-5.3.4
disk0:asr9k-li-px-5.3.4
disk0:asr9k-mcast-px-5.3.4
disk0:asr9k-mini-px-5.3.4
disk0:asr9k-doc-px-5.3.4
disk0:asr9k-fpd-px-5.3.4
disk0:asr9k-9000v-nV-px-5.3.4
disk0:asr9k-mpls-px-5.3.4
disk0:asr9k-px-5.3.4.sp3-1.0.0
Node 0/0/CPU0 [LC] [SDR: Owner]
Boot Device: mem:
Boot Image: /disk0/asr9k-os-mbi-5.3.4.sp3-1.0.0/lc/mbiasr9k-lc.vm
Active Packages:
disk0:asr9k-services-infra-5.3.4
disk0:asr9k-video-px-5.3.4
disk0:asr9k-optic-px-5.3.4
disk0:asr9k-k9sec-px-5.3.4
disk0:asr9k-bng-px-5.3.4
disk0:asr9k-services-px-5.3.4
disk0:asr9k-li-px-5.3.4
disk0:asr9k-mcast-px-5.3.4
disk0:asr9k-mini-px-5.3.4
disk0:asr9k-mpls-px-5.3.4
disk0:asr9k-px-5.3.4.sp3-1.0.0
Node 0/1/CPU0 [LC] [SDR: Owner]
Boot Device: mem:
Boot Image: /disk0/asr9k-os-mbi-5.3.4.sp3-1.0.0/lc/mbiasr9k-lc.vm
Active Packages:
disk0:asr9k-services-infra-5.3.4
disk0:asr9k-video-px-5.3.4
disk0:asr9k-optic-px-5.3.4
disk0:asr9k-k9sec-px-5.3.4
disk0:asr9k-bng-px-5.3.4
disk0:asr9k-services-px-5.3.4
disk0:asr9k-li-px-5.3.4
disk0:asr9k-mcast-px-5.3.4
disk0:asr9k-mini-px-5.3.4
disk0:asr9k-mpls-px-5.3.4
disk0:asr9k-px-5.3.4.sp3-1.0.0
Node 0/2/CPU0 [LC] [SDR: Owner]
Boot Device: mem:
Boot Image: /disk0/asr9k-os-mbi-5.3.4.sp3-1.0.0/lc/mbiasr9k-lc.vm
Active Packages:
disk0:asr9k-services-infra-5.3.4
disk0:asr9k-video-px-5.3.4
disk0:asr9k-optic-px-5.3.4
disk0:asr9k-k9sec-px-5.3.4
disk0:asr9k-bng-px-5.3.4
disk0:asr9k-services-px-5.3.4
disk0:asr9k-li-px-5.3.4
disk0:asr9k-mcast-px-5.3.4
disk0:asr9k-mini-px-5.3.4
disk0:asr9k-mpls-px-5.3.4
disk0:asr9k-px-5.3.4.sp3-1.0.0
RP/0/RSP0/CPU0:CR2.ALB9#
RP/0/RSP0/CPU0:CR2.ALB9#
RP/0/RSP0/CPU0:CR2.ALB9#
RP/0/RSP0/CPU0:CR2.ALB9#
RP/0/RSP0/CPU0:CR2.ALB9#
RP/0/RSP0/CPU0:CR2.ALB9#
RP/0/RSP0/CPU0:CR2.ALB9#show vrf mgmt
Mon Oct 2 09:23:00.498 EDT
VRF RD RT AFI SAFI
mgmt not set
RP/0/RSP0/CPU0:CR2.ALB9#
RP/0/RSP0/CPU0:CR2.ALB9#
RP/0/RSP0/CPU0:CR2.ALB9#
RP/0/RSP0/CPU0:CR2.ALB9#show route vrf mgmt
Mon Oct 2 09:23:06.340 EDT
Codes: C - connected, S - static, R - RIP, B - BGP, (>) - Diversion path
D - EIGRP, EX - EIGRP external, O - OSPF, IA - OSPF inter area
N1 - OSPF NSSA external type 1, N2 - OSPF NSSA external type 2
E1 - OSPF external type 1, E2 - OSPF external type 2, E - EGP
i - ISIS, L1 - IS-IS level-1, L2 - IS-IS level-2
ia - IS-IS inter area, su - IS-IS summary null, * - candidate default
U - per-user static route, o - ODR, L - local, G - DAGR, l - LISP
A - access/subscriber, a - Application route
M - mobile route, r - RPL, (!) - FRR Backup path
Gateway of last resort is 10.200.4.1 to network 0.0.0.0
S* 0.0.0.0/0 [1/0] via 10.200.4.1, 4w2d
C 10.200.4.0/24 is directly connected, 4w2d, MgmtEth0/RSP0/CPU0/0
L 10.200.4.9/32 is directly connected, 4w2d, MgmtEth0/RSP0/CPU0/0
RP/0/RSP0/CPU0:CR2.ALB9#
RP/0/RSP0/CPU0:CR2.ALB9#
RP/0/RSP0/CPU0:CR2.ALB9#
RP/0/RSP0/CPU0:CR2.ALB9#
RP/0/RSP0/CPU0:CR2.ALB9#show runn
Mon Oct 2 09:23:11.470 EDT
Building configuration...
!! IOS XR Configuration 5.3.4
!! Last configuration change at Fri Sep 29 10:55:31 2017 by admin
!
service unsupported-transceiver
hostname CR2.ALB9
clock timezone EST -5
clock summer-time EDT recurring
logging trap informational
logging buffered debugging
logging 10.200.10.3 vrf mgmt severity info port default
service timestamps log datetime localtime msec show-timezone
service timestamps debug datetime localtime msec show-timezone
domain name tvc-ip.com
domain name-server 66.109.38.250
domain name-server 66.109.38.251
domain lookup disable
cdp
cdp log adjacency changes
vrf mgmt
!
tcp selective-ack
tcp path-mtu-discovery
tcp synwait-time 5
line console
exec-timeout 30 0
stopbits 1
!
line default
exec-timeout 30 0
!
snmp-server ifindex persist
!!!! SNIP snmp-server community
ftp client vrf mgmt source-interface MgmtEth0/RSP0/CPU0/0
ntp
server vrf mgmt 10.200.4.248
!
tftp client vrf mgmt source-interface MgmtEth0/RSP0/CPU0/0
control-plane
management-plane
out-of-band
vrf mgmt
interface MgmtEth0/RSP0/CPU0/0
allow all
!
!
!
!
!!!! SNIP ipv4 access-list acl-speedtest
!!!!!!!!!!!!!!!!!!!!!!!!!
flow exporter-map jon-server
version v9
options interface-table timeout 60
template data timeout 60
!
transport udp 9999
source MgmtEth0/RSP0/CPU0/0
destination 10.200.2.40 vrf mgmt
!
flow exporter-map alb-nf-server
version v9
options interface-table timeout 60
template data timeout 60
!
transport udp 9995
source Loopback0
destination 66.109.40.150
!
flow exporter-map SORIN_FLOWTRAK_TEST
version v9
options interface-table timeout 60
template data timeout 60
!
transport udp 2055
source Loopback0
destination 72.0.128.7
!!!!!!!!!!!!!!!!!!!!!!!!
flow monitor-map ipv4
record ipv4
exporter jon-server
exporter alb-nf-server
exporter SORIN_FLOWTRAK_TEST
cache entries 1000000
cache timeout active 60
cache timeout inactive 15
!!!!!!!!!!!!!!!!!!!!!!!!!
sampler-map netflow-sampler
random 1 out-of 100
!!!!!!!!!!!!!!!!!!!!!!!!!
interface Bundle-Ether1
description Netflix
ipv4 address 66.152.103.49 255.255.255.240
ipv6 address 2607:fd48:0:1::1/112
load-interval 30
flow ipv4 monitor ipv4 sampler netflow-sampler ingress
!
interface Bundle-Ether2
description AR2.ALB1
mtu 9216
ipv4 mtu 9000
ipv4 address 66.109.52.61 255.255.255.252
ipv6 nd suppress-ra
ipv6 mtu 9000
ipv6 address 2607:fd48:ffff:fffe::15:1/126
load-interval 30
flow ipv4 monitor ipv4 sampler netflow-sampler ingress
!
interface Bundle-Ether9
description AR9-LAG
mtu 9216
ipv4 mtu 9000
ipv4 address 66.109.52.205 255.255.255.252
ipv6 mtu 9000
ipv6 address 2607:fd48:ffff:fffe::51:1/126
flow ipv4 monitor ipv4 sampler netflow-sampler ingress
!
interface Bundle-Ether45
description CR1.WIL1-LAG
mtu 9216
ipv4 mtu 9000
ipv4 address 66.109.52.105 255.255.255.252
ipv6 nd suppress-ra
ipv6 mtu 9000
ipv6 address 2607:fd48:ffff:fffe::26:1/126
load-interval 30
!
interface Bundle-Ether325
description BR1.NYC-325H
mtu 9216
ipv4 mtu 9000
ipv4 address 66.109.52.45 255.255.255.252
ipv6 nd suppress-ra
ipv6 mtu 9000
ipv6 address 2607:fd48:ffff:fffe::11:1/126
load-interval 30
flow ipv4 monitor ipv4 sampler netflow-sampler ingress
!
!!!! SNIP interface Loopback0
!
interface MgmtEth0/RSP0/CPU0/0
cdp
vrf mgmt
ipv4 address 10.200.4.9 255.255.255.0
speed 100
duplex full
!
interface MgmtEth0/RSP0/CPU0/1
shutdown
!
interface MgmtEth0/RSP1/CPU0/0
shutdown
!
interface MgmtEth0/RSP1/CPU0/1
shutdown
!
!!!! SNIP interface TenGigE0/0/0/0
!
!!!! SNIP prefix-set
!
!!!! SNIP route-policy
!
router static
address-family ipv4 unicast
!!!! SNIP
!
address-family ipv6 unicast
!!!! SNIP
!
vrf mgmt
address-family ipv4 unicast
0.0.0.0/0 10.200.4.1
!
!
!
router isis BB
!!!! SNIP
!
router isis ALB
!!!! SNIP
!
router ospf ALB
!!!! SNIP
!
router bgp 65001
bgp confederation peers
!!!! SNIP
!
ssh server vrf mgmt
end
RP/0/RSP0/CPU0:CR2.ALB9#
RP/0/RSP0/CPU0:CR2.ALB9#
RP/0/RSP0/CPU0:CR2.ALB9#
Can you explain what's happening? What are the real limits?
Thanks for any insights,
ERM
- Mark as Read
- Mark as New
- Bookmark
- Permalink
- Report Inappropriate Content
- Mark as Read
- Mark as New
- Bookmark
- Permalink
- Report Inappropriate Content
HI,
IS ASR 9000 will support flexible netflow/NBAR?
- Mark as Read
- Mark as New
- Bookmark
- Permalink
- Report Inappropriate Content
Sir Xander,
A quick (and perhaps simple) one for you on the topic.
Does the platform only exports ends Src and Dst AS info to the collectors (with relevant config in place) or is it also possible to export entire AS path ?
Regards
RC
- Mark as Read
- Mark as New
- Bookmark
- Permalink
- Report Inappropriate Content
Hello Xander,
Thanks for such an informative and helpful post. Impressive number of views!
I've seen in comments to this post a question from crdiego asking about origin of Aging fail counter. In that output there is one more suspicious counter increasing, namely Cache Overflows. Your answer about Aging fail said that it is not that bad, since flows are not really dropped, but rather will be sent at a later point in time because ring buffer of Flow exporter was full to accomodate these entries.
What I am missing in your reply is the explanation of Cache overflows. Is this one indicating dropped flows that eventually are not getting exported and really indicate lost Flow data? There is also Flows not added counter that exactly matches Cache overflows counter.
For reference - here's our output:
Cache summary for Flow Monitor :
Cache size: 800000
Current entries: 411
Flows added: 36274051
Flows not added: 4004623
Ager Polls: 2234369
- Active timeout 9623402
- Inactive timeout 25807741
- TCP FIN flag 842497
- Emergency aged 0
- Counter wrap aged 0
- Total 36273640
Periodic export:
- Counter wrap 0
- TCP FIN flag 0
Flows exported 36273640

Internal Information:
Cache Hits: 31611345
Cache Misses: 40278674
Cache Overflows: 4004623
Cache above hi water: 3
Flows dropped by ager: 0
Aging fail (ring full): 0
Periodic export fail: 0
Hash buckets: 0
Max hash depth: 0
Memory used: 109600948

Hash Statistics:
Bkt Depth:00000-00000 00001-00001 00002-00002 00003-00003 00004-00005 00006-00007 00008-00010 00011-00015 00016-00020 00021-00050 00051-00100 00101-00200 00201-00500 00501-01000 01001-65535
Current: 99579 411 0 0 0 0 0 0 0 0 0 0 0 0 0
Maximum: 1 0 0 0 0 1 2167 72213 25051 557 0 0 0 0 0
- Mark as Read
- Mark as New
- Bookmark
- Permalink
- Report Inappropriate Content
- Mark as Read
- Mark as New
- Bookmark
- Permalink
- Report Inappropriate Content
Hello!
If I am hitting a netflow rate-limit of 200k due to high sampling rate, does it affects (drops) user traffic forwarding?
Thanks
Find answers to your questions by entering keywords or phrases in the Search bar above. New here? Use these resources to familiarize yourself with the community: