- Cisco Community
- Technology and Support
- Collaboration
- Contact Center
- Re: Debug an HTTP Request in Webex Contact Center
- Subscribe to RSS Feed
- Mark Topic as New
- Mark Topic as Read
- Float this Topic for Current User
- Bookmark
- Subscribe
- Mute
- Printer Friendly Page
- Mark as New
- Bookmark
- Subscribe
- Mute
- Subscribe to RSS Feed
- Permalink
- Report Inappropriate Content
09-22-2023 02:34 AM
Hello,
I am just wondering if it is possible to show the outputs from an HTTP Request in Webex Contact Center. It seems impossible to tell why my request is failing. Everything seems encrypted.
Thanks
Solved! Go to Solution.
Accepted Solutions
- Mark as New
- Bookmark
- Subscribe
- Mute
- Subscribe to RSS Feed
- Permalink
- Report Inappropriate Content
09-26-2023 09:40 PM - edited 09-26-2023 09:59 PM
Hi Guys,
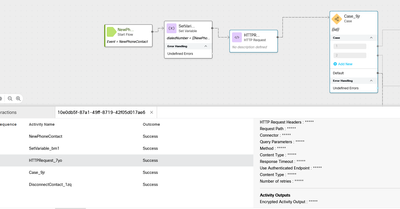
Here's a quick and dirty way to validate/debug what we are sending with that HTTPS Activity to an external system on Webex Contact Center, as mentioned previously, you could use Postman to build the request, test it and then build it in the HTTPS Activity, but it is easy to assign incorrectly stuff in the FlowScript so having the certainty that we are sending the message to the external application just like we prepped it in Postman is a key part of the troubleshooting.
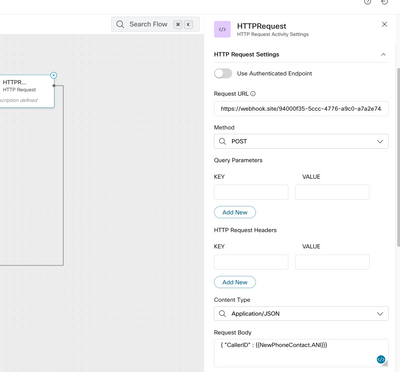
To do that just send the HTTP request to the dynamic URL generated by this website: https://webhook.site, and it will show you what you are sending in your HTTP message (headers and everything), for example, I am sending the calling number variable in the body of the HTTP request in a JSON format to the dynamic URL generated by https://webhook.site
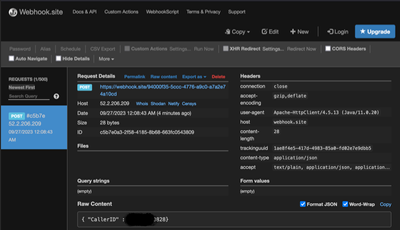
And now you can see what you sent, showing you the caller ID with all the headers in the API request.
Having to do this makes me miss UCCX-UCCE, any development IDE has a way to watch the value of variables and the responses of HTTP steps/elements/commands if there are available, but it seems that's the only way to do it in this case is by using an external tool to log the request (Splunk, Azure, or GoogleSheets as David alluded to), I wish they change this behavior or maybe someone points me on how to make the debug on WebexConnect more practical by providing a way to view this on the Send HTTP activity.
- Mark as New
- Bookmark
- Subscribe
- Mute
- Subscribe to RSS Feed
- Permalink
- Report Inappropriate Content
09-22-2023 03:24 AM
My advice: use the application "Postman" to test the request and see the output or error messages of the response.
And after it works in Postman, configure the request in WxCC the same way.
- Mark as New
- Bookmark
- Subscribe
- Mute
- Subscribe to RSS Feed
- Permalink
- Report Inappropriate Content
09-22-2023 03:27 AM - edited 09-22-2023 03:31 AM
Thank you for the reply, yep works great in postman. Just not in in this step. But I am more asking if there is anyway to see the encrypted output in the debug. thanks again
- Mark as New
- Bookmark
- Subscribe
- Mute
- Subscribe to RSS Feed
- Permalink
- Report Inappropriate Content
09-22-2023 03:49 AM - edited 09-22-2023 03:50 AM
I faced the same issue and figure out a way to be able get it done using Google sheets out of all things. I’ve been meaning to post a blog about it, but I’ve not gotten around it. Ping me directly and I can show you what I’m doing and hopefully it can help you. You can ping me on WebEx at first name at squareo.com.
david
- Mark as New
- Bookmark
- Subscribe
- Mute
- Subscribe to RSS Feed
- Permalink
- Report Inappropriate Content
09-26-2023 09:40 PM - edited 09-26-2023 09:59 PM
Hi Guys,
Here's a quick and dirty way to validate/debug what we are sending with that HTTPS Activity to an external system on Webex Contact Center, as mentioned previously, you could use Postman to build the request, test it and then build it in the HTTPS Activity, but it is easy to assign incorrectly stuff in the FlowScript so having the certainty that we are sending the message to the external application just like we prepped it in Postman is a key part of the troubleshooting.
To do that just send the HTTP request to the dynamic URL generated by this website: https://webhook.site, and it will show you what you are sending in your HTTP message (headers and everything), for example, I am sending the calling number variable in the body of the HTTP request in a JSON format to the dynamic URL generated by https://webhook.site
And now you can see what you sent, showing you the caller ID with all the headers in the API request.
Having to do this makes me miss UCCX-UCCE, any development IDE has a way to watch the value of variables and the responses of HTTP steps/elements/commands if there are available, but it seems that's the only way to do it in this case is by using an external tool to log the request (Splunk, Azure, or GoogleSheets as David alluded to), I wish they change this behavior or maybe someone points me on how to make the debug on WebexConnect more practical by providing a way to view this on the Send HTTP activity.
- Mark as New
- Bookmark
- Subscribe
- Mute
- Subscribe to RSS Feed
- Permalink
- Report Inappropriate Content
09-27-2023 05:03 AM
Thank you @mparra.fusionet and @david.macias for helping me debug this issue. The webhook.site was very helpful, as soon as I sent my request to that site I saw what my error was in my config (I was sending the variable name and not the actual variable). It literally took 5 minutes to fix it.
Thanks Again!
Discover and save your favorite ideas. Come back to expert answers, step-by-step guides, recent topics, and more.
New here? Get started with these tips. How to use Community New member guide


